


Step 5. Finding interesting proteins
 Just as we did with features earlier in the workflow, we can now find interesting proteins in
our samples.
Just as we did with features earlier in the workflow, we can now find interesting proteins in
our samples.
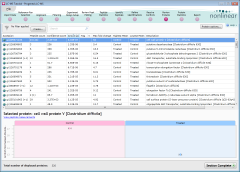
The Review Proteins (right) screen presents us with a list of all identified proteins their descriptions and measurements. In the lower half of the screen, we can see the expression pattern across the experimental conditions of the selected protein.
While the expression graph is useful for a quick check of individual proteins, in this tutorial, we really want a quick way to find all proteins that have a significantly higher expression in our Treated condition than in the Control samples.
Finding significantly changed proteins
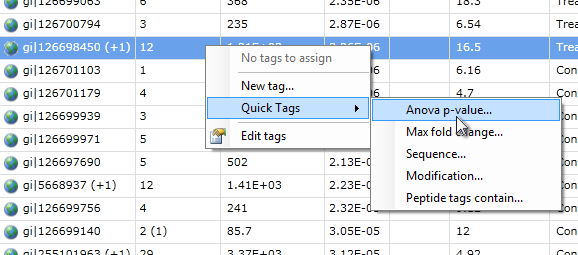
This first step is very simple, as we can again use a Quick Tag to finding significant differences in expression. This time, however, we'll be creating tagged proteins rather than tagged features:
- Right-click on any protein in the list.
- From the pop-up menu that appears (show me), select the Anova p-value… option in the Quick Tags sub-menu.
- When the New Quick Tag window appears, accept the default criteria of ≤ and 0.05, as well as the default name and tag color, and click Create tag.
As you can see, this tag is applied to nearly all identified proteins. This is fully expected, as we only identified the peptides that were significantly changed themselves. Any proteins whose p-value is greater than 0.05 may have been identified incorrectly. In your own experiments, this is worth investigating further, but for this tutorial we'll simply continue with only the tagged proteins:
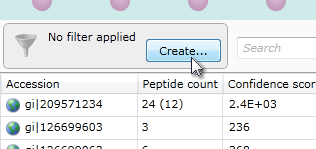
- Click the Create... button in the grey filter box above the list of proteins.
- In the Create a filter window, click on the Anova p-value ≤ 0.05 tag and drag it to the top box on the right-hand side: Show proteins that have all of these tags.
- Click OK to apply the filter.
We now just need to find out which of these proteins have a higher expression in our Treated samples.
Finding specific expression behaviours
 There are now a number of ways in which we could identify the up-regulated proteins, but we'll use a particularly
powerful way of exploring expression changes: correlation analysis.
There are now a number of ways in which we could identify the up-regulated proteins, but we'll use a particularly
powerful way of exploring expression changes: correlation analysis.
- Click the Section Complete button to move on to the Protein Statistics screen.
- As the screen loads, it will calculate another Principal Components Analysis, this time for the proteins. When it finishes, we can again see that the runs cluster by condition. However, we're not interested in the PCA plot at this point.
- Click on the Ask Another Question button near the top-left of the screen.
- From the menu that appears, select the second entry: Correlation Analysis. The software will then start its calculations.
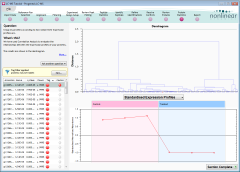
Once complete, the upper half of the Protein Statistics screen shows a dendrogram. By clicking on its branching points, we can view the expression profiles of all proteins under that branch. Try exploring this yourself – it's an interesting way to learn about your data. When you're satisfied, click the right-hand branch at the top branching level, as shown here:
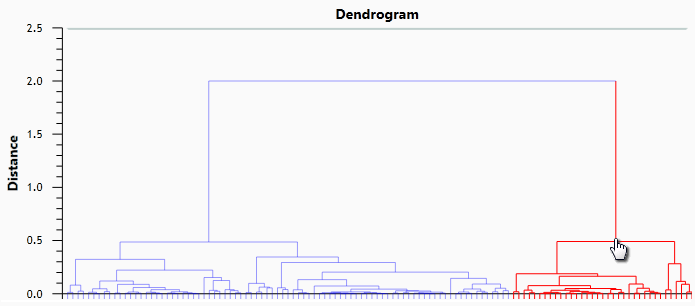
As you will see in the expression profiles below the dendrogram, this branch contains proteins that are more abundant in our Treated samples than in the Control samples. We'll keep track of these proteins by creating another tag:
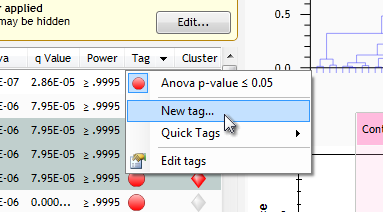
- Click the small arrow in the title of the Tag column to display the tag-editing pop-up.
- In the pop-up, click the New Tag... option.
- In the Create new tag window, enter a tag name of Up in Treated and click OK.
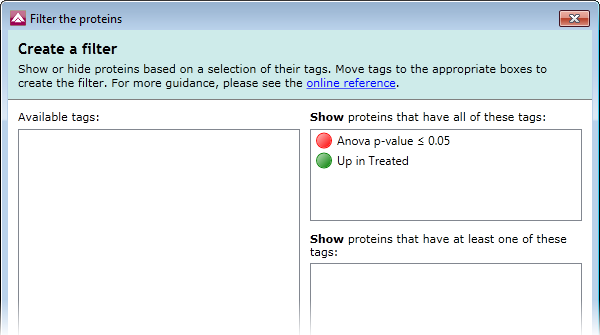
All of the proteins in the selected dendrogram branch will now have the Up in Treated tag. To filter the data to show only these proteins, we should now:
- Click the Edit... button in the filter box, above the list of proteins.
- In the Create a filter window, click on the Up in Treated tag and drag it to the top box on the right-hand side: Show proteins that have all of these tags (show me).
- Click OK to apply the filter.
We have now achieved our aim of identifying proteins whose abundance is signficantly greater in the Treated samples compared to the Control samples. By returning to the Review Proteins step, we could then take the time to investigate each of the proteins further, but for this tutorial, we are complete.