


How do I use the QC metrics modifications chart?
This chart shows the mean number of modifications present on the identities assigned to each peptide ion, on a run-by-run basis. Only runs in the current experiment design are included, and the runs are grouped by condition. The highest scoring identification is used for the peptide ion in every case for calculation purposes.
Any kind of modification may be included, as was specified in the search database. This will include both biological and technical modifications, potentially. It is possible to select those included using the tick-boxes on the chart should you wish to focus on a particular sub-set.
Hovering over a point will bring up a tooltip with run details. The mean (indicated by pinch-arrows) and error bars are also provided (+/- 1 SD) for conditions. When you hover over the error bars in one condition, they will be superimposed upon the others for comparison.
To interpret this chart, you may wish to group your samples by processing batches and focus on certain modifications; for example, phosphorylation is a labile post-translational modification (PTM) which may be vulnerable to processing effects such as incomplete phosphatase inhibition, or loss in fragmentation. Carbamidomethylation of cysteine is another potential example, relevant in terms of the effectiveness of reduction and alkylation-based pre-processing.
In general, both atypical values and outlying groups based on processing batches may be worthy of further investigation. However, biologically interesting information may also be gleaned through comparing your study groups for PTMs as well.
Your search parameters are also important; naturally these could limit the range of potential modifications that may be reported.
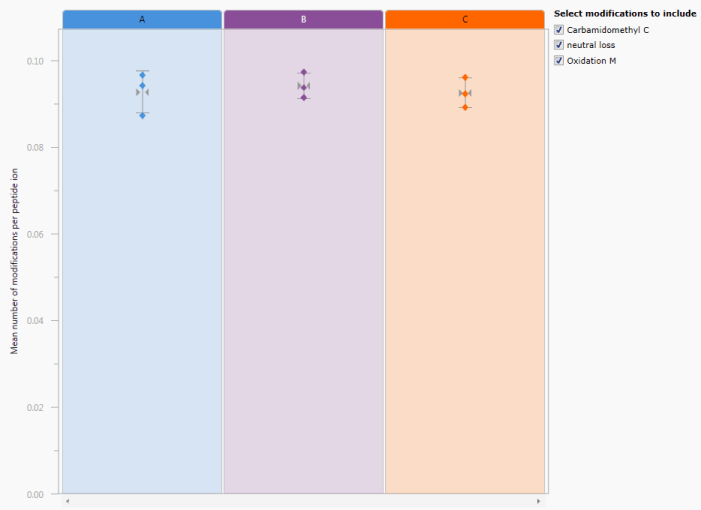
The Modifications chart. In this case, three conditions are being compared, with every run plotted individually but runs clustered by condition. Three modifications were searched in this case and are presented on the right for selection purposes.