


How do I use the QC metrics overview screen?
The Overview page allows you to quickly examine several useful metrics. The individual components of this page are detailed through the links on the main QC Metrics page.
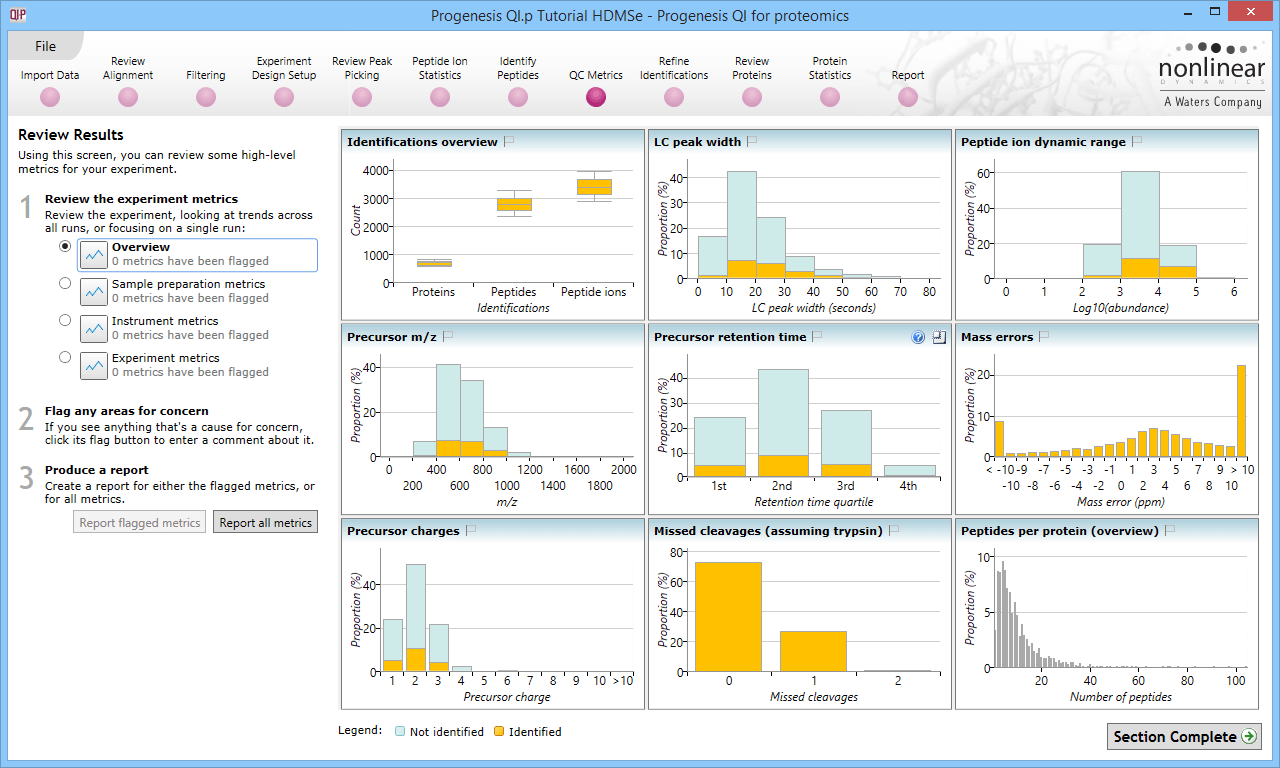
The Overview section with all charts minimised; the starting page for QC Metrics. The menu on the left can be used to navigate between the sections.
Note that the overview metrics can each be expanded by clicking on the top-right icon that appears when you mouse over a chart. Additionally, hovering over a column in the chart will bring up a tooltip containing quantitative information on the results (as shown below).
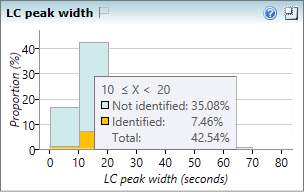
Hovering over a column will bring up a tooltip with summary statistics.
See also
- How do I use the QC metrics screen?
- How do I use the QC metrics identifications overview chart?
- How do I use the QC metrics LC peak width chart?
- How do I use the QC metrics peptide ion dynamic range chart?
- How do I use the QC metrics precursor m/z chart?
- How do I use the QC metrics precursor retention time chart?
- How do I use the QC metrics mass errors chart?
- How do I use the QC metrics precursor charges chart?
- How do I use the QC metrics missed cleavages chart?
- How do I use the QC metrics peptides per protein chart?