


How do I use the QC metrics precursor charges chart?
This is a proportional distribution chart, showing the relative distribution of the charge states of all the peptide ion precursors in the experiment (given the single aggregate codetection, this is not affected by changing the experimental condition groupings).
Peptide ions successfully identified are marked in yellow, to allow examination of the proportion identified with each charge. Charges above 10 are aggregated together to increase the resolution of the most relevant region.
The values shown in this chart reflect the degree and success of ionisation, and for example, skew to low or high values may reflect too low or too high a collision voltage (among many other factors!). In terms of identified features, any limits you apply on allowed charge states in database searching will also apply here.
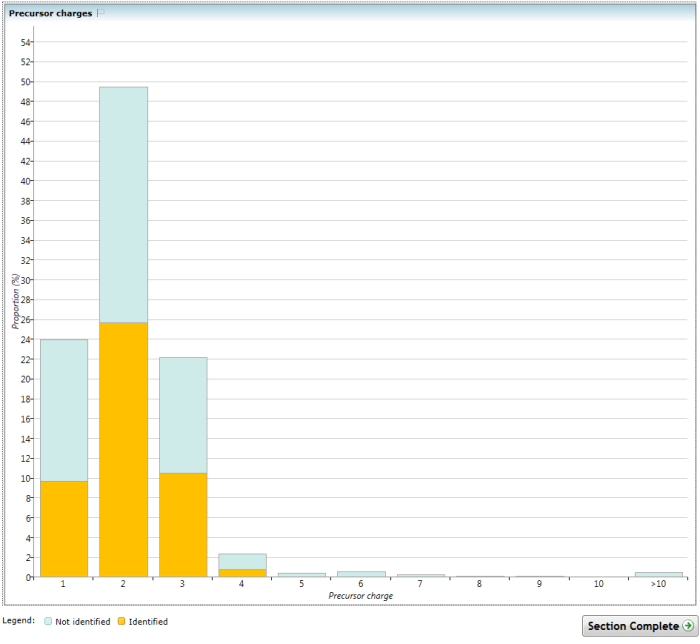
The Precursor charges chart
See also
- How do I use the QC metrics screen?
- How do I use the QC metrics overview screen?
- How do I use the QC metrics identifications overview chart?
- How do I use the QC metrics LC peak width chart?
- How do I use the QC metrics peptide ion dynamic range chart?
- How do I use the QC metrics precursor m/z chart?
- How do I use the QC metrics precursor retention time chart?
- How do I use the QC metrics mass errors chart?
- How do I use the QC metrics missed cleavages chart?
- How do I use the QC metrics peptides per protein chart?