


How do I use the QC metrics percentage of peptide ions identified chart?
This chart shows the percentage of peptide ions in each run that have been identified. Given the aggregate co-detection, this is calculated relative to the same total in all cases within an experiment; the unique value within a run is determined by the number of identifications originating from MS2 / MSE data within that run. Hence, as with other charts quantifying identifications, for example the Peptides chart, limiting the MS2 spectra exported for database searching at the Identify Peptides window may affect this chart.
Only runs in the currently selected experiment design are shown, and runs are grouped by condition. Hovering over a point will bring up a tooltip with run details. The mean (indicated by pinch-arrows) and error bars are also provided (+/- 1 SD) for conditions. When you hover over the error bars in one condition, they will be superimposed upon the others for comparison.
This chart allows you to assess identifications across runs and batches via an alternative metric, but is related in principle to the other Experiment metrics charts. Outlying values may indicate problems with sample preparation, chromatography, or MS. Low values across all runs may also indicate a problem with the identification process (for example, search settings or database used).
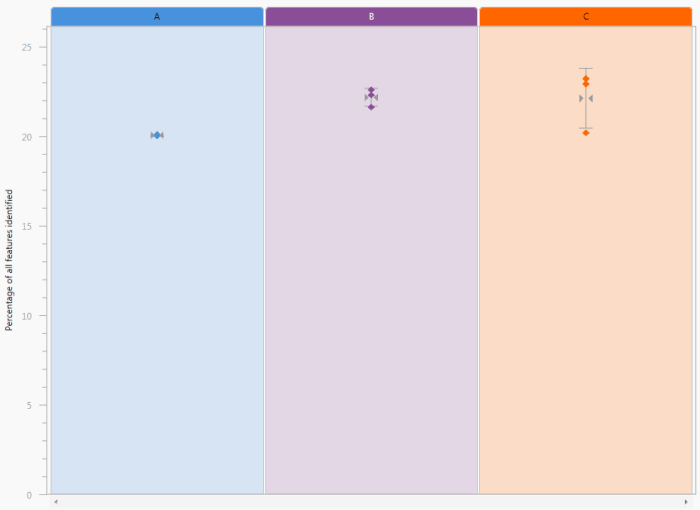
The Percentage of peptide ions identified chart. In this case, three conditions are being compared, with every run plotted individually but runs clustered by condition.