


How are compound measurements calculated?
Please note:
For the purposes of this article, it is assumed that you are familiar with the
fundamental concepts of the QI workflow. If not,
it may help to read that article first.
Calculating compound abundances
To calculate the compound measurements seen in the Review Compounds screen (Anova p-value and fold change), as well as those in the Progenesis Stats screen (q-value and power), we need to know the abundances of the compounds in each run.
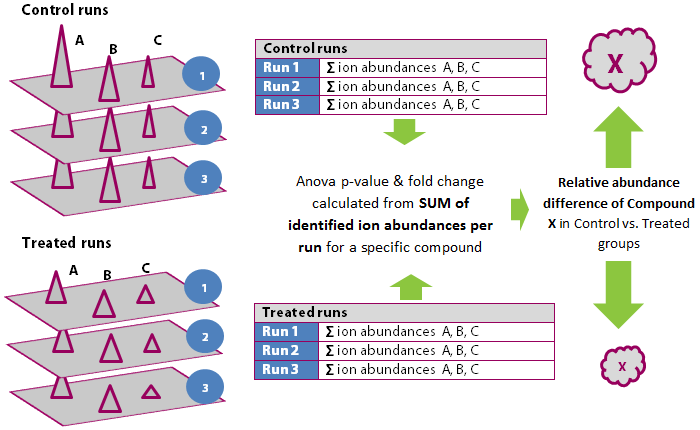
Remember that each compound in a run is represented by one or more compound ions; and each compound ion represents a different adduct form of the original compound. To determine the abundance of any compound, therefore, we simply sum the abundances of its compound ions.
For example, in the diagram below, we have three ions — A, B and C — each identified as a different adduct form of Compound X. Each of these ions has an abundance in each of the six runs. To calculate the abundance of Compound X on each run, we sum the abundances of the ions A, B and C on each run.
Calculating the compound statistics
The other measurements calculated for each compound are: Anova p-value; fold change; q-value; and power. These give information about how the compound abundances are changing across the experimental conditions and, in simple terms, information about the reliability of the changes seen.
Anova (p)
To calculate these values, the per run abundances are transformed using a variance stabilisation technique and grouped by the experimental condition. Analysis of Variance is then performed on the variance stabilised values.
Maximum Fold Change
To calculate the maximum fold change for a compound, we first calculate the mean abundance for that compound in each experimental condition. These mean values are then placed in a condition-vs-condition matrix to find the maximum fold change between any two conditions' mean compound abundances.
q-values
The term “q-value” is the name given to an adjusted p-value, found using an optimised False Discovery Rate (FDR) approach. Consequently, the calculations for q-values are based on the p-values, which are themselves based on the compounds' per-run, variance-stabilised abundances.
Power
As with p-values and q-values, the statistical power of a compound's measurements is calculated from the variance-stabilised, per-run abundances, grouped by experimental condition. This gives us the probability of finding real differences, if they exist.