


What does the grid in the top half of the screen show me?
The screen shows single- and multi-ion compounds differently.
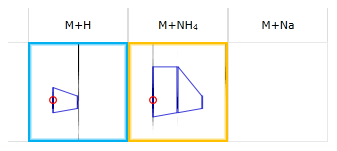
For multi-ion compounds, the adducted form for each ion has been determined based on the mass shifts between them, and a single line of small ion maps is shown. Each square shows the location where a given adducted form would be found, based on the adducts selected when creating the experiment. Adduct forms already included in the compound have their ion map highlighted in the adduct colour:
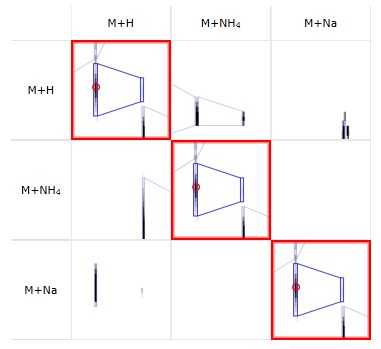
For single-ion compounds, the adduct form of the ion is unknown. In this case, a matrix of ion maps is shown. One row is shown for every adduct form the ion might be, showing where other adduct forms would be if the current ion was that adduct form. Only rows that correspond to a valid adduct forms will appear, i.e. if the ion is singly charged, rows will not appear for charge 2 or charge 3 adducts.
What's shown in each square?
As well as the ion intensities, each adduct's square shows:
- the outlines for all ions in that area; ions that are part of the compound have a strong outline, while all other ions have a faint outline
- a small circle whose location indicates the expected m/z value of the square's adduct and the retention time (RT) of the compound as a whole; for adducts that are known to form part of the compound, this circle is red and always visible, whereas for unconfirmed adduct forms, the circle is blue and only visible when hovering the mouse over the square.
- a ‘location tip’ in the top-right of the square; hovering the mouse over this will show the square's coordinates in m/z and RT.