


How can I validate my compounds?
Double-clicking on a compound in the Review Compounds screen shows the compound validation view. This view presents information about your compound and its adduct forms that allows you to confirm that their measurements are valid.
- A montage of ion maps helps to validate the ions' peak picking and alignment
- Graphs of mass spectra and chromatograms provide further confirmation of correct peak picking
Reviewing the compound
Review the compound's adduct forms one at a time, selecting the current adduct form in the list at the top-left of the screen; the ion maps and graphs will update to show the relevant ion's data. (You can also show the ion's location within the full ion map by selecting the Show Location option at the top-right of the screen.)
Below the list of adducts, a drop-down list lets you select whether you want to see the selected adduct:
- on the experiment aggregate
- across all runs, or
- only on runs within a single experiment condition
The Experiment aggregate option is most useful for validating the ions' peak picking, as the aggregate is generated immediately prior to peak picking and is used as the input to that process.
The other options (All runs and the experimental conditions) are more helpful for validating alignment, as they make it possible to see individual runs whose MS1 ion intensities are aligned inconsistently when compared to the other runs in their condition, or across the experiment as a whole. When using one of these options, you can use the Ion map layout options to control how many ion maps you can see:
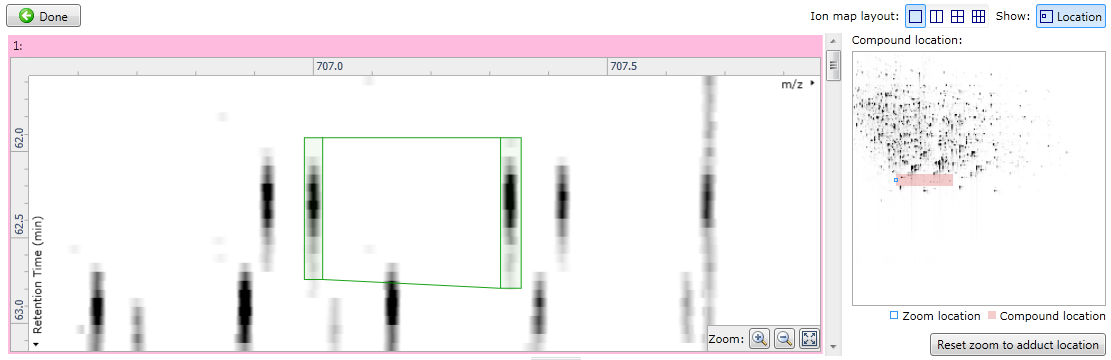
Fig 1: showing only a single large ion map and the location within the whole ion map.
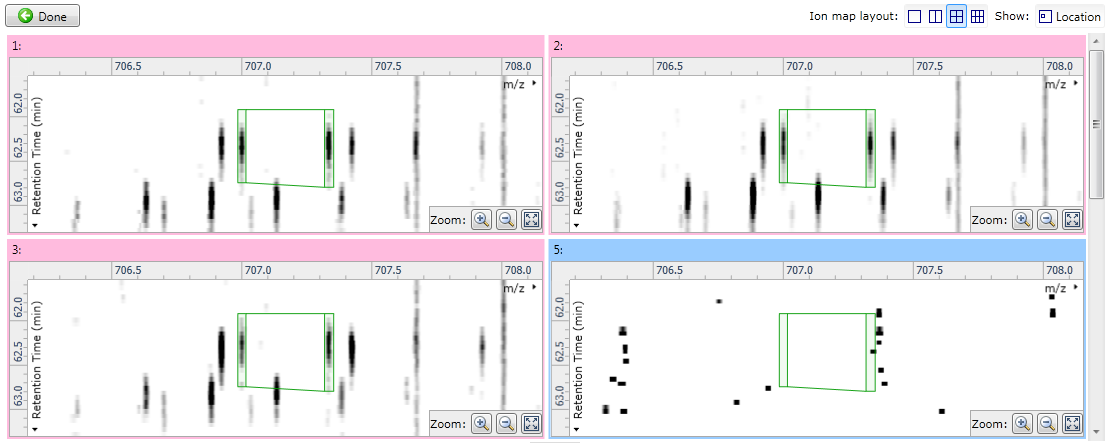
Fig 2: showing four ion maps simultaneously to allow comparisons.
Below the ion maps, the selected adduct's mass spectra and chromatograms are shown for the selected runs. Each line on the graphs corresponds to a single run, coloured according to the experiment condition to which it belongs. If you hover the mouse over a line, the name of the run which generated it will appear. When showing all runs, these graphs give further validation of how the adduct form's abundance is changing between experimental conditions.
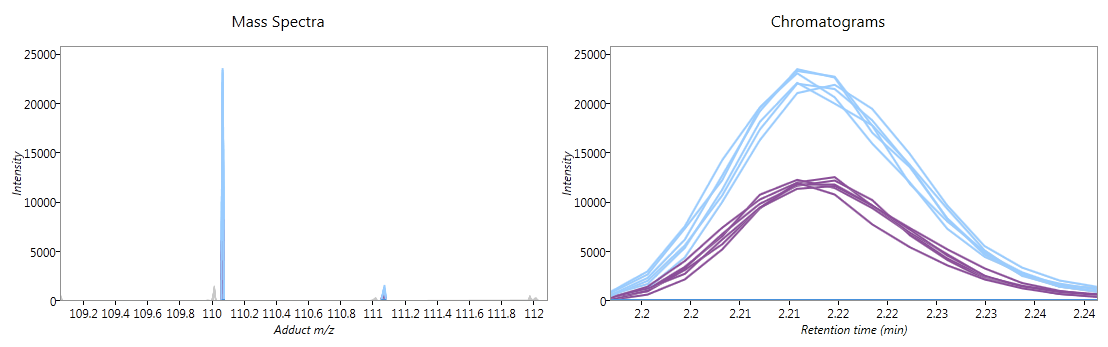
Fig 3: mass spectra and chromatograms
Editing the compound
If the adduct has a missing monoistopic peak, you can edit the adduct to add the missing peak.
Note: this is only possible for single adduct compounds; if the compound has multiple adducts, you will need to return to the Review Deconvolution screen to remove the adduct from its compound before editing it. (Tip: tagging the compound first can make it easier to track between screens.)
Once the compound has only a single adduct, you can edit it by clicking the Edit adduct button in the instructions at the left of the screen. Two buttons then appear on the ion maps: a "+" button to the left of the adduct's outline; and a "−" button over the adduct's monoisotopic peak. Clicking the "+" button will add a new monoisotopic peak to the compound:
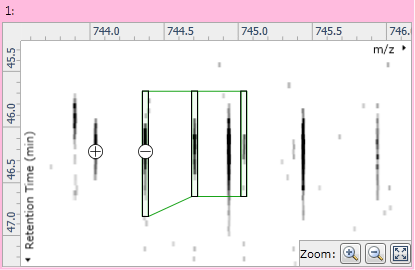
Fig 4: The + and − buttons used for isotope addition and removal
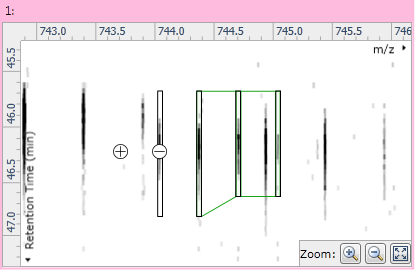
Fig 5: After adding a new monoisotopic peak
Clicking on the "−" button will remove the monoisotope from the adduct. Once you're happy with the adduct's isotopes you can click the Save edits button to permanently modify the compound, or the Discard edits button to undo your changes.
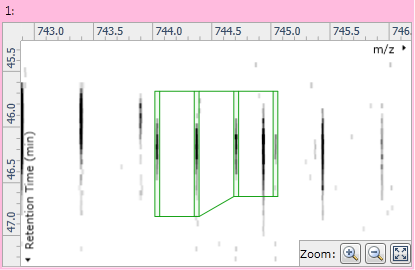
Fig 6: The modified adduct with the new edits saved
After editing an adduct, it's recommended that you return to the Review Deconvolution screen to see whether the corrected adduct should now form part of another compound.