


How do I export my peptide ion, peptide and protein measurements for external analysis?
Whilst Progenesis QI for proteomics allows you to carry out univariate and multivariate statistical tests within the software, and provides multivariate visualisation of your data along with QC metric charts, it is possible you may wish to carry out different analyses to suit your specific situation. To this end, the software allows the export of your data at the peptide ion, peptide and protein level (the latter two after identification has been performed).
In all cases, the data are only exported for the active tag filter (by default) and experimental grouping, but the values are not recalculated in any way – the restriction is purely a content filter. To export all data, use i) a grouping containing all the runs to avoid restricting the columns; and ii) either clear any active tag filters, or select at the appropriate dialog (below) not to limit the export by tags, to avoid restricting the rows.
Peptide ion data
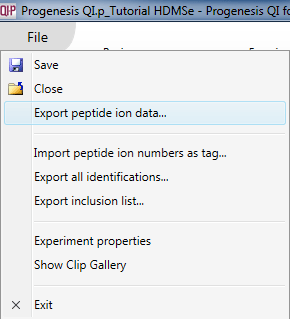
These correspond to isotopic clusters derived from a single charge state of a given peptide (identified or unidentified). These data can be exported at the Review Peak Picking, Peptide Ion Statistics, Identify Peptides and Resolve Conflicts windows by selecting File | Export peptide ion data... as shown below:
The export can be customised by using the list that then appears. Data are available on the nature of the peptide ion itself (including m/z, retention time, mass and charge, for example, based on the aggregate); on the inter-group differences associated with the peptide ion and its variability (including the ANOVA value for the current experiment design group comparison for that peptide ion, maximum fold change for that design across any two groups, highest and lowest group mean, and the maximum group CV); and quantitative peptide ion data. The raw and normalised abundance are the key columns in this last category for external analyses, and spectral count data are available for the highest-scoring identification associated with the peptide ion. The final tick-box allows you to deselect the tag filter, as mentioned previously.
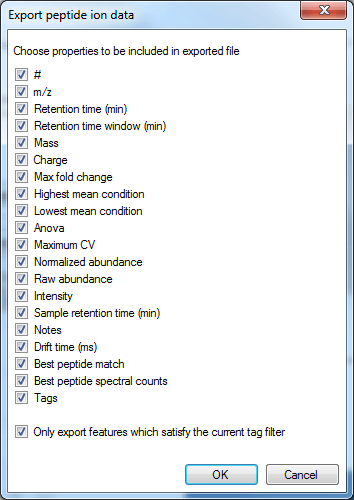
The column selection dialog box for Export peptide ion data.
A csv (comma-separated values) file is then generated; you will be given a pop-up dialog prompting you to name and save the file, and then the option to open the file immediately.
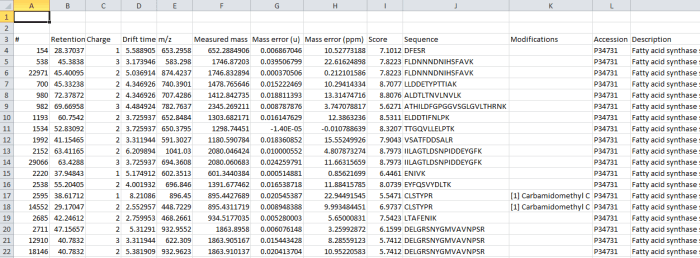
In the file generated by the export, the rows are your peptide ions (isotopic groups of peaks corresponding to a single peptide ion). These are as numbered by the software, for example at the Review Peak Picking and Peptide Ion Statistics windows. The columns contain the selected data outputs for each peptide ion.
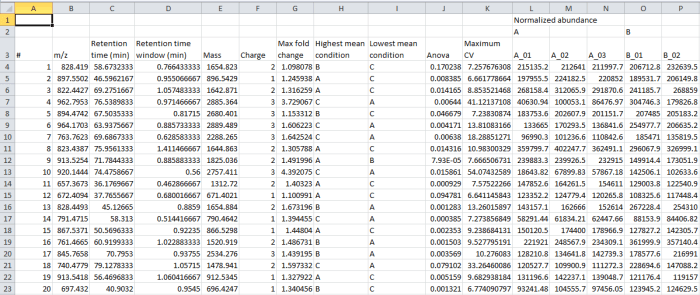
Screenshot of the csv export resulting from the Export peptide ion data option.
Re-importing your results from external analyses
Once you have carried out any external analyses you wish, you can re-import your results as a tag. This allows you to record externally derived results alongside your software-derived results, and visualise them together. To do this, create a simple text file with the relevant peptide ion numbers listed in a column, and select File | Import peptide ion numbers as tag... as shown below. The pop-up box will guide you through the process.
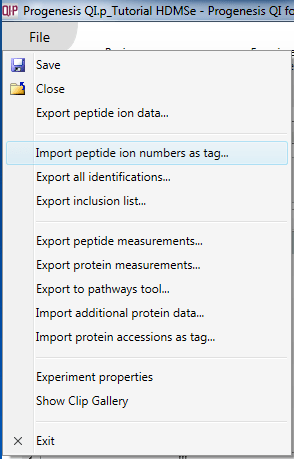
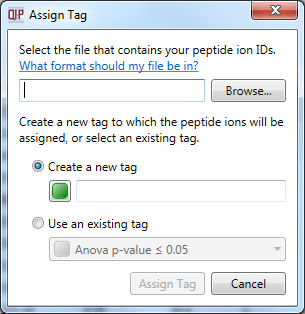
The dialog box that will appear on selecting the Import peptide ion numbers as tag option.
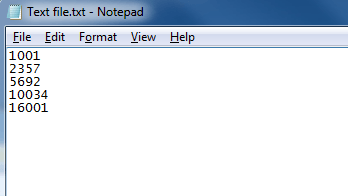
A simple text-based file suitable for peptide ion import with numerical identifiers corresponding to those used for the peptide ion in the software.
Peptide data
These can be exported in a similar manner, at the Resolve Conflicts, Review Proteins and Protein Statistics windows, by selecting File | Export peptide measurements... from the menu.
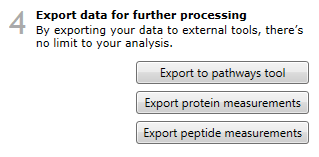
Alternatively, they can be exported at the Review Proteins window by using the Export peptide measurements button in step 4 on the side-bar:
The data are still peptide-ion based (each row is a single charge state of a now-identified peptide ion). However, all the peptide ions are now grouped by the peptide sequence they are derived from, and so measures can be easily aggregated for the entire peptide if desired.
The data columns available include quantitative information on the peptide ion, identification data and also the spectral counting data for each peptide, as below:
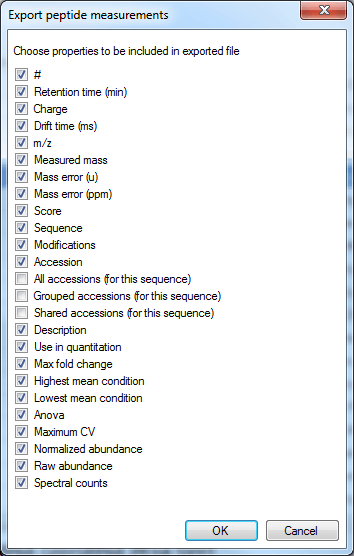
The column selection dialog box for Export peptide measurements.
The Use in quantitation column indicates whether a peptide ion was selected for use in protein abundance calculation by the quantitation scheme being employed (for example, using unique peptides only or Hi-N will result in only a subset of peptide ions contributing).
Screenshot of the csv export resulting from the Export peptide measurements option.
Re-importing your results
The import process for the results of any external analyses is identical to that for peptide ions. It is driven by the peptide ion number, not peptide sequence.
Protein Data
Once you have identified proteins present and the software has 'rolled up' peptide-ion-based data to the protein level, it is possible to export protein-level results for external analyses in a csv format.
These data can be exported at the Resolve Conflicts, Review Proteins, and Protein Statistics stages by selecting File > Export protein measurements... from the menu.
Alternatively, they can be exported at the Review Proteins window by using the Export protein measurements button in step 4 on the side-bar:
In this case, the rows are your proteins listed by accession. The columns contain the selected outputs for that protein. These can include quantitative protein data as provided at the Review Proteins and Protein Statistics windows, along with spectral counting MS2 data where appropriate, as shown below. The normalised abundance is available in this export for external analysis.
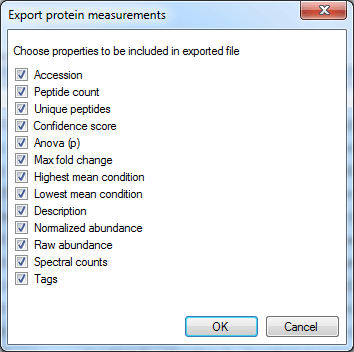
The column selection dialog box for Export protein measurements.
Note: the Spectral counts tick-box is not available if you are quantitating proteins using the Hi-N method, as these data would be misleading when only a limited number of the peptides are being considered. If you do wish to export these data, please switch to either relative quantitation using non-conflicting (unique) peptides or relative quantitation using all peptides at the Protein options dialog.
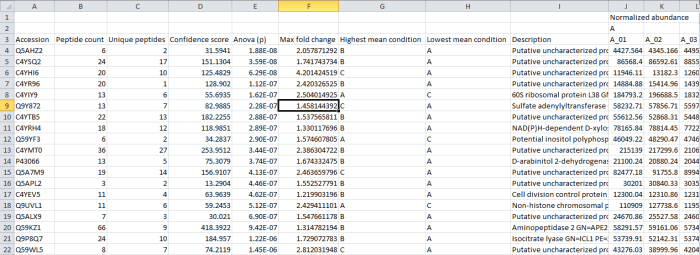
Screenshot of the csv export resulting from the Export protein measurements option.
Re-importing your results
Analogously to the Import peptide ion numbers as tag... option, it is possible to bring back into the software a list of proteins of interest derived from external analyses. This is done by creating a list of accessions, and then selecting File | Import protein accessions as tag... from the menu. Note that tags at the protein and peptide ion level are independent.
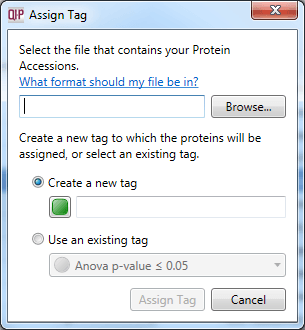
The dialog box that will appear on selecting the Import protein accessions as tag option.