


How do I use the QC metrics peptides per protein chart?
This chart shows the mean number of peptides identified per protein in each of the runs within the currently selected experiment design. Runs are grouped together by experimental condition. Hovering over a point will bring up a tooltip with run details. The mean (indicated by pinch-arrows) and error bars are also provided (+/- 1 SD) for conditions. When you hover over the error bars in one condition, they will be superimposed upon the others for comparison.
As with the Identifications overview chart, only peptides belonging to quantifiable proteins are considered.
This chart is designed to give you an indication of the degree of coverage achieved in protein identities on a run-by-run basis, which may affect both your confidence in the identities obtained and in quantitation.
You may wish to group your samples by any processing batches, in order to check for any technical effects on the identification process. As for the overview version of this chart, many factors may affect the value returned, including problems with sample preparation, chromatography, or instrument settings.
An important point to note relating to this chart is the potential effect of MS2 filtering, based on how the software carries out the identification process. The no-missing-values approach of Progenesis QI for proteomics means that identifications in one run are passed to the same detected peptide ions in other runs; in effect, MS2/MSE data are pooled across a feature’s runs. Peptide and protein identifications can then be built from the pooled data.
In summary in a simplified case, this means that where there is no successful MS2/MSE identification in run X, but a confident identification was gained in run Y, then run X will be quantitated as that same entity.
However, in this chart, counting identifications on a run-by-run basis, the intention is to show you identification data resulting from that run. To count for a given run, a peptide must belong to a protein that is quantifiable in the experiment, and the number of peptides present for that protein in that run is the number of peptides for that protein with MS2/MSE identification results present in that run (as opposed to transferring identifications to them purely based on data from another run).
A consequence of this is that if you limit your MS2 spectra at the Identify Peptides window on exporting to an external search engine, that may affect this chart (for example with a limit of the 5 highest ranked spectra being exported, the top 5 may come from only one run, despite other runs being capable of providing MS2 data for the same identity if included).
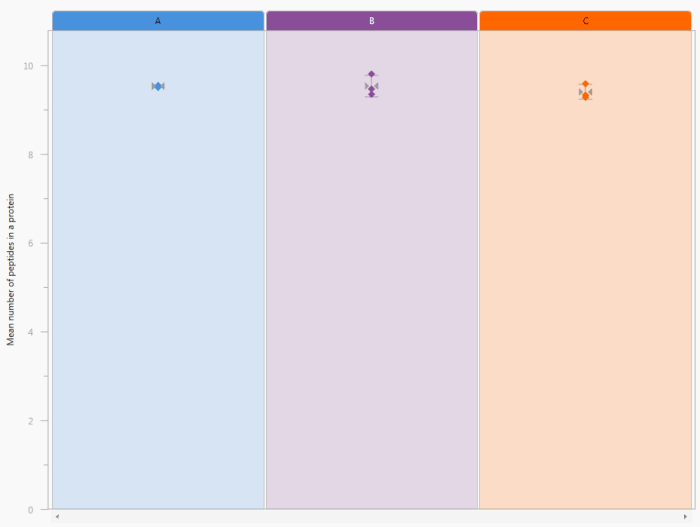
The Peptides per protein chart. In this case, three conditions are being compared, with every run plotted individually but runs clustered by condition.