


How do I use the QC metrics scan rates chart?
These charts show the precursor scan rate over the entire retention time (RT) duration of a run, for all conditions in the current experimental design, highlighting one run at a time and overlaying it on the data for the condition as a whole.
Time points are plotted every 2*N seconds (where N=30 if the total run time is greater than 15 minutes, and N=15 otherwise). At every time point, the value plotted is the average number of scans per second within a window N seconds either side of the time point (i.e. the number of scans in that window divided by the window size in seconds).
The selected run within each condition can be altered using the drop-down option or arrows above each chart:
The mean, maximum and minimum values are plotted for the whole condition in silver. The currently selected run is plotted on top of this trace in black.
Particularly with DDA-based methods, the scan rate may vary as automatic switching to MS2 is carried out. This can affect the accuracy of MS1-based quantitation, both within a run where the scan rate varies, and also across runs where the scan rate at the same point on different runs is different. This plot allows you to get an indication of if, and where, this may be occurring.
For example, for an MSE experiment, the rates are relatively constant:
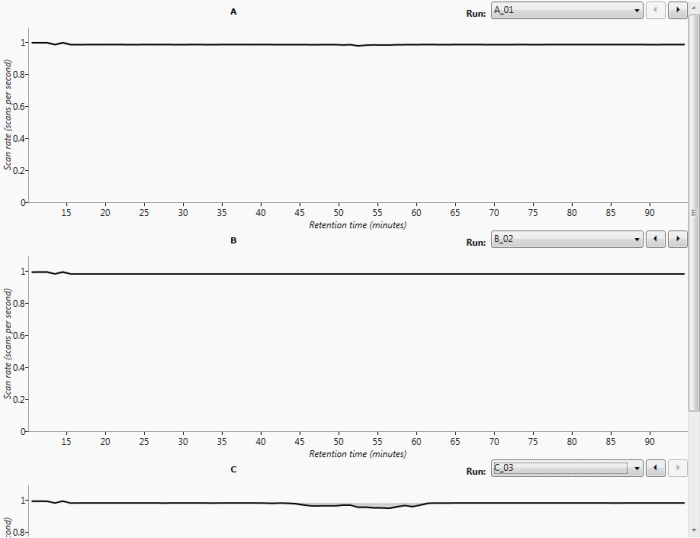
Example MSE data plotted on the MS1 scan rates charts. Note little variation during and between runs.
However for typical DDA data, the variation is more pronounced and the spread of the conditions relative to an individual run trace can be seen more clearly:
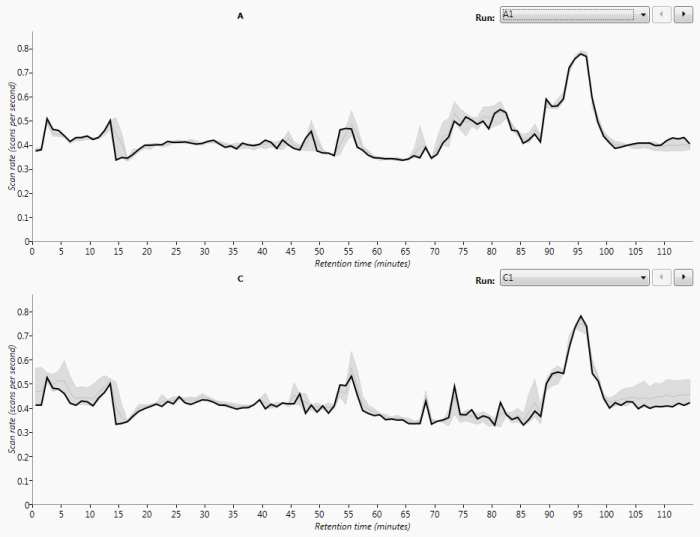
Example DDA data plotted on the MS1 scan rates charts. Note the significant variation during a run and increased variability across runs.