


What is an ion intensity map?
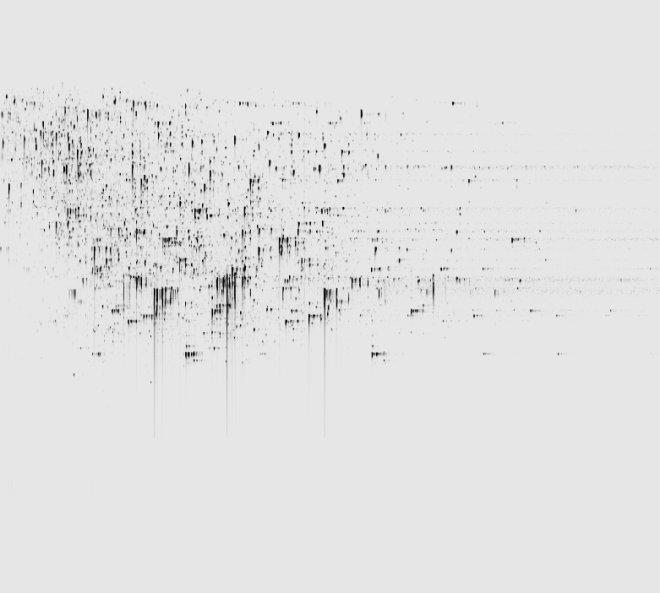
An example of an ion intensity map
An ion intensity map, or “ion map” for short, is a 2D representation of the ions in an LC/MS run.
Retention time increases from top to bottom, while m/z increases from left to right, with the darker areas representing a high abundance of ions in the MS signal.
What can ion maps show me?
By examining the pattern of ion intensities on these maps, we can sometimes identify problems in the chromatography that can adversely affect the analysis.
Zooming in, for a closer look
For some problems, the cause is only apparent when zoomed in. For example, streaks that appear to be column leaching may, in fact, be electronic noise when viewed at a higher magnification. This can be done in the Import Data screen, after the run has been imported.
To zoom into an area of your ion map, press and hold the left mouse button at the top-left corner of the desired area, drag to the the bottom-right corner, and release the mouse button. Alternatively, you can use the Zoom In and Zoom Out buttons at the bottom-right of the ion map (show me).
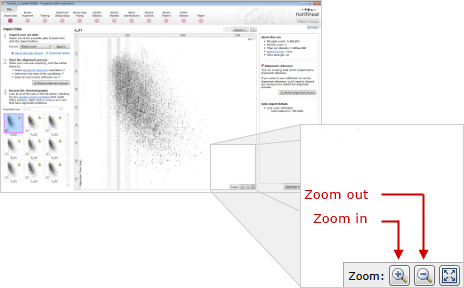
To return to showing the whole run, click the Show Whole Run button alongside the zooming buttons.