


How do I use the QC metrics peptides per protein chart?
This chart shows the proportional distribution of the number of peptides identified per protein, combined across all runs in the experiment. An alternative visualisation dividing these data by experimental condition is available in the Experiment metrics section.
As with the Identifications overview chart, only quantifiable proteins and their peptides are included, and in this overview chart the MS2/MSE data providing the peptide identifications may be derived from any run, as it is an aggregate count (compare to the run-by-run Peptides per protein chart in Experiment metrics).
This distribution will depend on a wide range of factors. Sample preparation, instrument performance and settings and identification search settings will all play a part. However, it is fair to say that if this distribution is focussed at unusually low values, for example, you might be concerned that both quantitative data and identification coverage may be compromised.
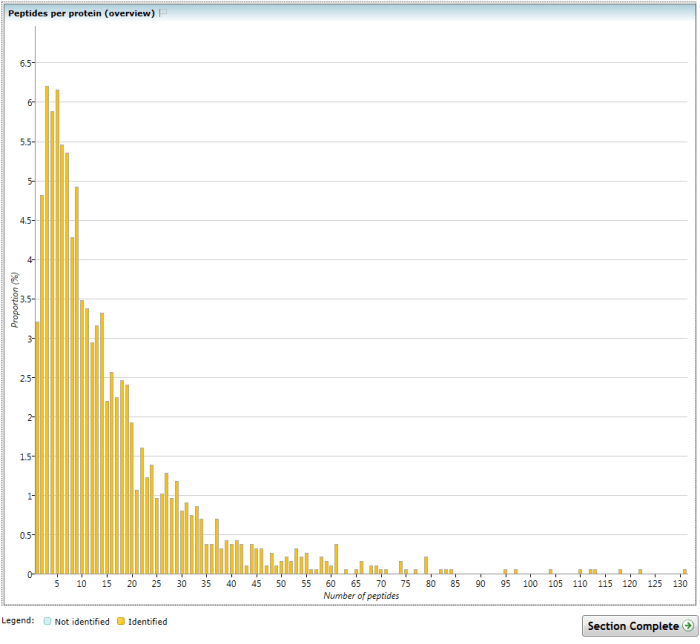
The (Overview) Peptides per protein chart.
See also
- How do I use the QC metrics screen?
- How do I use the QC metrics overview screen?
- How do I use the QC metrics identifications overview chart?
- How do I use the QC metrics LC peak width chart?
- How do I use the QC metrics peptide ion dynamic range chart?
- How do I use the QC metrics precursor m/z chart?
- How do I use the QC metrics precursor retention time chart?
- How do I use the QC metrics mass errors chart?
- How do I use the QC metrics precursor charges chart?
- How do I use the QC metrics missed cleavages chart?