


How does data analysis with Progenesis QI for proteomics work?
LC-MS/MS provides you with a way to relatively quantify and identify thousands of proteins from complex samples. Each LC-MS/MS run generates large, data rich files that need sophisticated analysis to efficiently process them, extract the useful data and provide the best proteome coverage. Progenesis QI for proteomics has been developed to achieve this.
For efficient and objective analysis the process of importing files, selecting a reference run and aligning the runs can be performed automatically by our software. Then, the quality of your LC-MS runs can be assessed with objective alignment scores and visual displays for their potential to generate reliable measurements.
Here we’ll focus on the most fundamental steps within the Progenesis QI for proteomics analysis workflow. Details of the automated data processing approach are covered separately here.
Peak modelling
Online LC-MS can generate very large data sets, which can make it impractical to run a large numbers of replicates. To overcome this we’ve developed an intelligent peak-modelling algorithm that can reduce data files by an order of magnitude. Using a wavelet based approach, peaks are identified and peak models created that retain all relevant quantification and positional information.
Progenesis QI for proteomics supports all the common data formats produced by high-resolution LC-MS systems. This means not just those from Waters, but also Bruker, Agilent, AB Sciex and Thermo, as well as cross-vendor file formats including mzXML, mzML and NetCDF. Enhanced functionality is available when you analyse data from Synapt-G2, Synapt G2S and Synapt –G2Si high-definition mass-spectrometers.
Run Alignment
The ability to combine data from multiple LC-MS runs is required for comparative expression profiling studies. This enables the comparison of different experimental conditions using a high number replicates. To combine and compare results from different runs, Progenesis QI for proteomics aligns them to compensate for between-run variation in the LC separation technique. This results in increased reliability and reproducibility. This results in increased reliability and precision of peak picking and peptide abundance measurements.
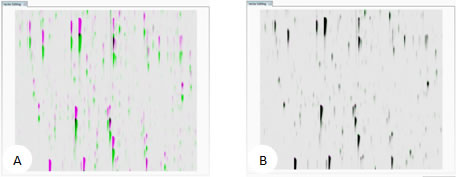
LC-MS runs represented as m/z vs. RT overlaid. (A) unaligned runs (B) aligned runs
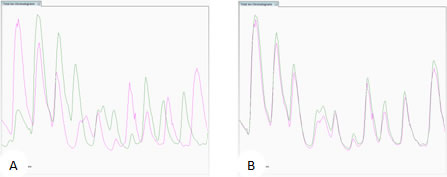
Total Ion Chromatogram view. (A) unaligned runs (B) aligned runs
The key to generating the best alignment of your runs means choosing the best Reference Run, which all other runs are aligned to. This is typically one that contains the majority of peptide ions, so it may be a pool of all your samples or a control. The software can objectively choose the best reference run then apply alignment automatically. The quality of this process is reported by scores and visual displays.
Peak Picking
To ensure consistent peak picking and matching across all data files, an aggregate data set is created from the aligned runs. This contains all peak information from all sample files, allowing the detection of a single map of peptide ions. This map is then applied to each sample, giving 100% matching of peaks with no missing values, enabling you to apply multivariate statistical tools to explore your data and measure differential analysis.
The peak picking algorithm handles complex samples and can discern overlapping peptide ions. The software is also fully compatible with ion mobility data so you can achieve three dimensions of resolution and increase peak capacity.
The end result is highly accurate detection which saves time further down the workflow. It also generates complete datasets containing no missing values that allow you to get reliable results from the multivariate statistical tools.


Ion abundance quantification
For the most accurate measurements, the survey scan data is used for ion abundance quantification. This significantly outperforms spectrum counting, and allows for quantification of peptide ions without MS/MS data (additional MS/MS data can be gathered afterwards, using a targeted inclusion list). Users of Waters systems benefit from data-independent analysis using MSᴱ and HDMSᴱ as well as data-dependant analysis. After measuring each of the runs, the data is then normalised so we can make comparisons between the runs.
Statistical analysis of peptide ions
Using advanced statistical tools - including ANOVA, power analysis and q-values (for false discovery rate) - you can choose which peptides you want to identify.
Peptide identification
Once you have your list of peptide ions that you want to identify, you can export their MS/MS data for searching using any of the search engines and databases supported.
For any features that don't have enough, or any, MS/MS data you can export a targeted inclusion list for a replicate run of samples to gather more MS/MS data, so you can increase your identification coverage for the peptides of interest.
Review the proteins of interest
Quantitative data and qualitative fragmentation spectra search results are brought together to produce a peptide-based view of potentially interesting proteins in your experiment, with the ability to resolve conflicts when a peptide sequence is associated with more than one protein. You can also easily tag unique peptides and select the best ones as candidates for future MRM studies.
A final list of interesting proteins and their measurements, including a display of expression profiles in each group, is automatically generated. Protein quantification is automatically based on unique peptides only. This gives you more reliable quantification for biological studies and publications.


Statistical analysis of protein data and report results
You can then choose to perform multivariate statistics on protein measurements to make confident conclusions and generate a protein-based (top-down) report of your experiment. Protein measurements can also be exported to any custom bioinformatics workflow, and supplementary data or new results imported back into your analysed experiment.