


What do the visualisations at Review Alignment show?
Alignment is the key stage in the Progenesis workflow. It focuses on bringing all your LC/MS profile data into the correct alignment, enabling accurate peak picking and a rapid, robust and statistically-driven analysis.
This article will talk you through the layout of the screen at Review Alignment, including details on each of the 4 main visualisations.
Alignment table
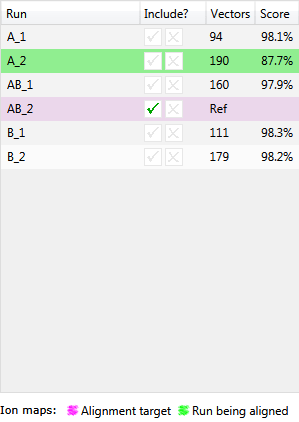
This table shows each run’s name, whether it is to be included in the analysis, the number of vectors currently placed, and its alignment score.
The reference run will be highlighted in magenta (when using the default colour scheme) and the run currently being aligned will be highlighted in green.
You can choose to order this table by its columns by clicking on the column header; for example you may want to sort the table by alignment score in order to concentrate on the review of your alignment.
Vector editing window
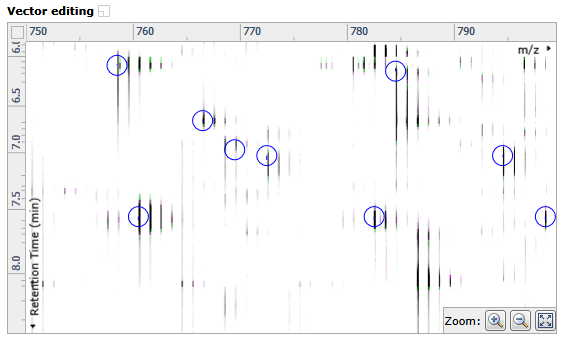
This is the main alignment window and shows the current focus as defined in the Ion intensity map window. This is where you place alignment vectors — automatic vectors are blue, and manual vectors are red. Ions in the current run are displayed in green while those in the reference run are displayed in magenta.
Transition window
![]()
This window switches between showing the current and reference runs, continuously fading between the two, and shows the same area of the runs as seen in the Vector editing window.
Before runs are aligned, the ions will appear to move back and forwards in the retention time direction; once correctly aligned, the ions will appear stationary, but may pulse due to intensity differences between the current run and the reference run.
Ion intensity map window
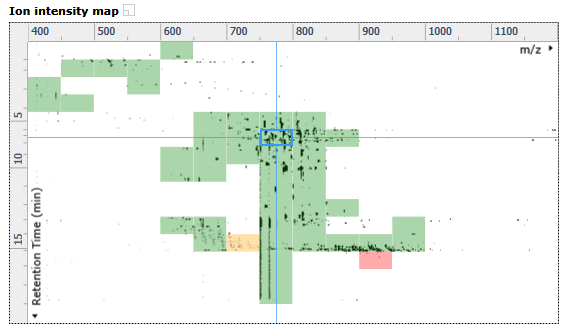
This shows the ion intensity map for the entire current run. The blue crosshair defines the current focus as reflected in the other 3 windows. The alignment quality heat map is displayed here to allow you to quickly review the quality of the alignment for the current run.
Total ion chromatogram window
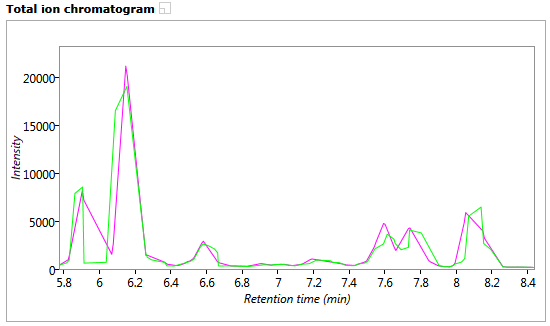
This shows the total ion chromatogram for the current run in green, overlaid with the reference run chromatogram in magenta. The retention time range displayed matches that shown in the Vector editing and Transition windows. As ions are aligned in the Vector editing window the chromatograms will become aligned.
Tip: All 4 of the windows can be maximised by clicking on the Maximise icon next to their names:

Show Aligned / Show Unaligned
These buttons at the top of the alignment screen allow you to adjust the view in each of the alignment visualisation windows in order to assess the quality of the alignment.
The Show Aligned option allows you to see how well aligned the data is currently with the vectors in place. If you select the down arrow on this button, the option Always Show Aligned will appear. Upon selecting this, even if you switch to view a different run, you will still be on Show Aligned as opposed to defaulting back to Show Unaligned.
The Show Unaligned button allows you to assess how accurate the alignment is by reviewing the length and direction of the vectors. Excessively long vectors suggest either incorrect placement of vectors or large inconsistencies in RT between runs.