


How are peptide ion abundances calculated?
The peptide ion outlines mark the boundaries of each isotope that forms part of the peptide ion. The peptide ion abundance is the sum of the areas below scan lines within the isotope boundaries. In the example below the red shaded areas are used when calculating the abundance of that peptide ion.
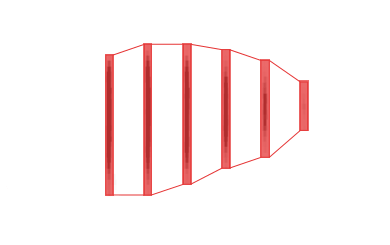
Red shaded areas are included in the abundance
This means we can separate out the abundances of overlapping peptide ions, as shown in the example below.
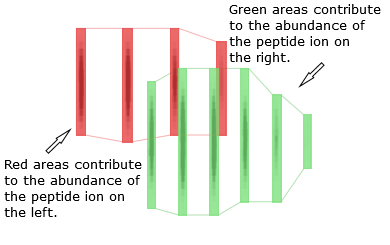
The abundance of overlapping peptide ions
How does the calculated peptide ion abundance measurement relate to its maximum intensity?
Peptide ion abundance is a sum of areas calculated using intensities of a given peptide ion's constituent peaks as one of the inputs, the other one being those peaks' width. The maximum intensity value is taken directly from a single point within the isotope boundaries. Therefore, those values are not directly comparable and it is not unusual for a peptide ion to have its maximum intensity reported as being higher than its abundance.