


How do I decide which identifications are correct?
After importing identifications for your features, you may find that some compounds have more than one possible identification. In the Review Compounds screen, the possible identifications for the selected compound are listed on the Possible identifications tab. To confirm the compound's true identification, you need only click the star alongside the Compound ID, marking it as the accepted identification.
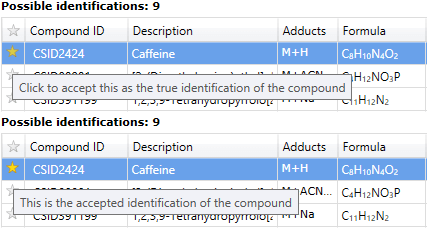
Accepting an identification at the Possible identifications tab.
However, how do you decide which identification is the correct one? Here are a few considerations that can influence your decision:
Validating compounds
Before choosing an identification for an interesting compound, it is worthwhile validating the peak picking and alignment. You can get to the compound validation screen by double clicking on a compound in the table, or by clicking the Review selected compound button.
If you make any edits to a compound's adducts, you should return to the Review Deconvolution screen to see if the modified adducts can be assigned to other compounds. Once deconvoluted, you can then re-import your identifications and proceed to choose identifications.
Highest identification score
If you're identifying compounds using a metabolite database that assigns each identification a score, with the highest value for a given compound representing the most likely identification, this appears in the Score column of the Possible identifications list.
You could simply accept the identification with the highest score, but even if you have score values, it's still recommended that you validate the identifications with some of the other considerations listed here.
The presence of peptides
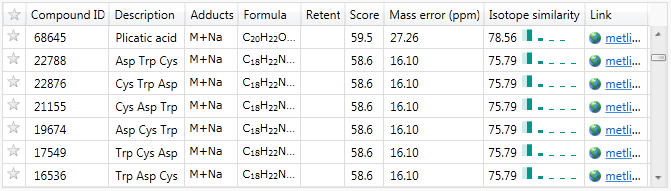
If you can safely ignore amino acids and peptides for your compound identifications, this may provide a way to drastically reduce the number of identifications under consideration for a given compound. This is especially true with peptide chains, as the same set of amino acids could be present in different orders to produce the same compound mass, as seen in this example:
Isotope abundance profiles
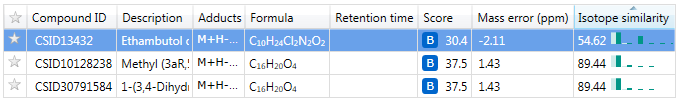
As well as an overall identification score, the possible identifications table shows an Isotope similarity score and visualisation. The score ranges from 0 to 100, with 100 being a perfect match between theoretical and measured isotope abundance distributions.
The theoretical isotope abundances are shown in dark blue, and the measured isotope abundances are shown in light blue. Hovering over the visualisation shows the abundance data. In the example below, the first identification has poor similarity, so the other two identifications would be favoured:
Knowledge about the samples
Finally, if your knowledge of how the samples were obtained leads you to believe that certain compounds are simply unlikely to be present, you can use that to inform your decision of which is the correct identification.