Progenesis Stats - watch the patterns emerge from your proteomics data...
Progenesis Stats is an advanced, easy-to-use statistical analysis tool for further interrogation of proteomics data. The unique approach of Progenesis LC-MS, Progenesis MALDI and Progenesis SameSpots produces results with no missing values, so you can confidently apply both univariate and multivariate statistical techniques for a complete exploration of your protein expression data. This powerful tool solves the statistics headache for proteomics researchers.
2D gel electrophoresis data
LC-MS data
The latest version of Progenesis Stats seamlessly integrates with the Progenesis LC-MS, Progenesis MALDI and Progenesis SameSpots workflows.
What does this mean for my proteomics data analysis?
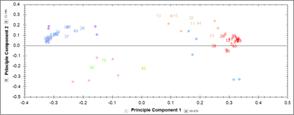
Principal Components Analysis
This is an unsupervised technique (i.e. it does not use any knowledge of the groupings of the data) which provides a simplified graphical representation of the multidimensional data. It is useful for determining if samples have the groupings expected or if there are any outliers in the data. Examining the PCA plot is a useful Quality Control check before further analysis..
Correlation Analysis
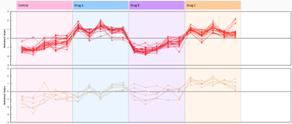
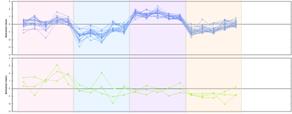
Proteins or peptides are grouped by their expression patterns using correlation analysis and hierarchical clustering. This unsupervised, multivariate analysis provides a true snapshot of protein activity across an experiment and identifies features in the same biological processes and pathways that may characterise disease states.
The results are shown in an interactive dendrogram tree where similar expression profiles cluster together. Data can be explored at group level on the dendrogram, and the corresponding expression profiles update on-the-fly.
Power Analysis
The power of a statistical test can be defined as the probability that it will find a significant expression change where it exists. It depends on the sample size and can calculate the effect of running a different number of replicates.
A generally accepted power threshold is 80%. A power analysis can be performed on a pilot study and the number of replicates required to achieve the target power of 80% can be calculated.
False Discovery Rate and Q-values
The q-value tells us the expected proportion of false positives if that feature's p-value is chosen as the significance threshold. This provides greater power for finding truly significant features.
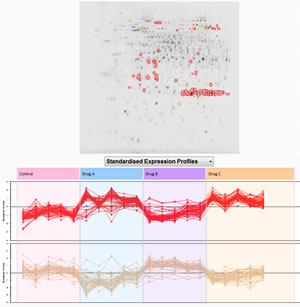
Classify significant features using tags
Groups of proteins or peptides can be classified using the new colour coded tags which gives exceptional flexibility when you are surveying your data. This highly effective and visual approach helps you to determine which features are interesting and therefore warrant further investigation.
Display interesting results on your images
If you are using Progenesis Stats to view 2D results analysed by Progenesis SameSpots, you can highlight spots on the gel image which you have tagged, or which cluster in the correlation analysis. This allows you to quickly pinpoint which spots on the gel image have similar behaviour patterns, and see the actual locations of the spots on the gel and print or save this image.