


How do I use the QC metrics identifications overview chart?
This chart shows the number of identifications obtained over all runs that are present in the current experiment design. The box represents the inter-quartile range, and the whiskers the maximum and minimum values. The identifications cover all the 'levels' - how many peptide ions have been successfully identified and assigned to peptides, how many peptides have been identified, and how many proteins have correspondingly been identified.
This chart allows you to assess the number of identifications experiment-wide or over all runs of a particular design combined, and relate it to your expectations and other experiments. The Experiment metrics (Proteins, Peptides, Peptides per protein, Percentage of peptide ions identified, and Proteins per condition) allow a group-by-group investigation at each level in more detail.
The counts are based on 'quantifiable proteins' and the entities that comprise them. These are proteins that are included in quantitation under the selected quantification scheme. For example, when all peptides are used for quantitation, all proteins are quantifiable. However, if only unique peptides are used in quantitation, then proteins without any unique / non-conflicted peptides would not be quantifiable and would not be counted. This would also be affected by protein grouping.
On this basis, the 'proteins' count is naturally all quantifiable proteins in the experiment. The 'peptides' count is all peptide identifications that belong to quantifiable proteins, without duplication (if two quantifiable proteins contain the same peptide, it is only counted once), but counting all peptides for that protein, conflicted or not. Likewise, the 'peptide ion' count is all peptide ions that have been identified as a peptide that contributes toward a quantifiable protein, without duplication. These are experiment-design-wide measures; hence an identification in any run will contribute.
Note that peptides with different post-translational or other modifications are counted as unique entities for the purposes of this chart.
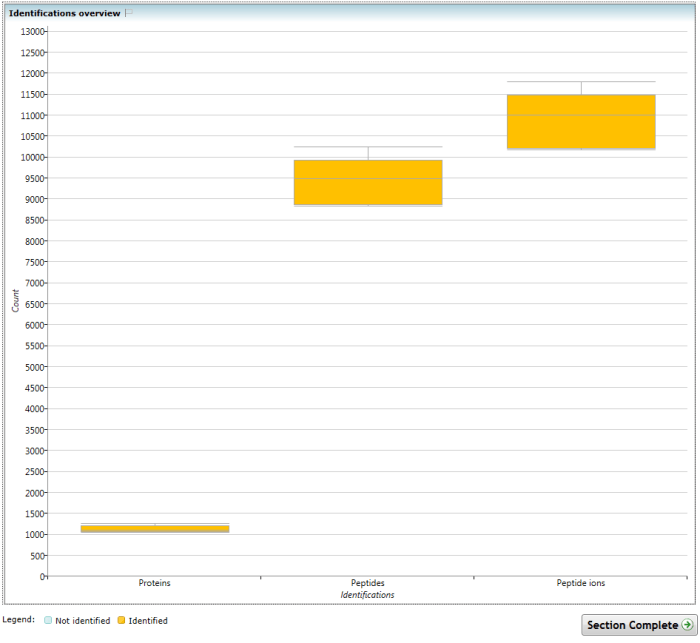
The Identifications overview chart. Successful identifications are counted at the protein, peptide and peptide ion levels for all quantifiable proteins and subspecies thereof.
See also
- How do I use the QC metrics screen?
- How do I use the QC metrics overview screen?
- How do I use the QC metrics LC peak width chart?
- How do I use the QC metrics peptide ion dynamic range chart?
- How do I use the QC metrics precursor m/z chart?
- How do I use the QC metrics precursor retention time chart?
- How do I use the QC metrics mass errors chart?
- How do I use the QC metrics precursor charges chart?
- How do I use the QC metrics missed cleavages chart?
- How do I use the QC metrics peptides per protein chart?