


How do I use the QC metrics LC peak width chart?
This chart shows the proportional distribution of retention time peak widths in seconds, for all the detected peptide ions in the experiment (given the single aggregate detection, this is not affected by changing the experimental condition groupings). Widths are binned into columns. This chart is designed to reveal whether elution of peaks is occurring as expected for your chromatographic set-up; if the mean peak width is higher or lower than is typical for your system, you may wish to investigate the chromatography, or alter your detection settings.
Successfully identified peptide ions are shown within the bars in yellow, to allow visualisation of the proportion of peptide ions that have been successfully assigned to peptides and any correlation of this with peak width. The example demonstrates the more successful identification of peptide ions with a longer peak width, which might be expected given these are likely to be more abundant.
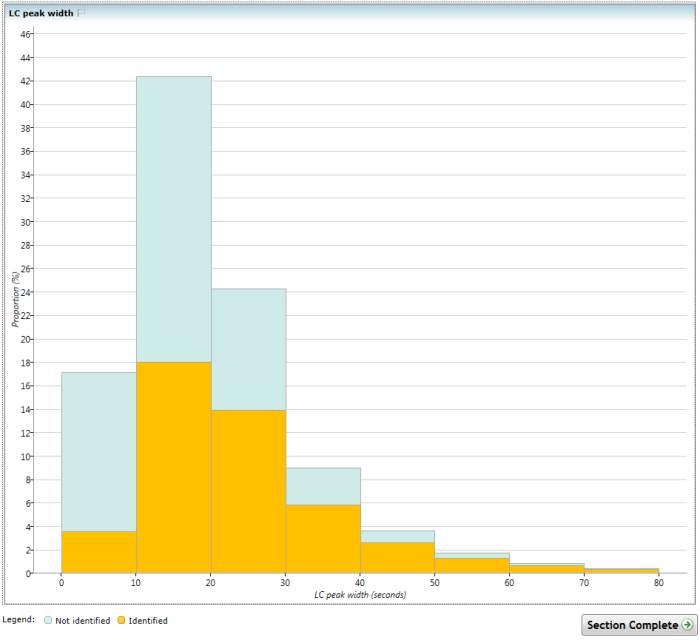
The LC peak width chart.
See also
- How do I use the QC metrics screen?
- How do I use the QC metrics overview screen?
- How do I use the QC metrics identifications overview chart?
- How do I use the QC metrics peptide ion dynamic range chart?
- How do I use the QC metrics precursor m/z chart?
- How do I use the QC metrics precursor retention time chart?
- How do I use the QC metrics mass errors chart?
- How do I use the QC metrics precursor charges chart?
- How do I use the QC metrics missed cleavages chart?
- How do I use the QC metrics peptides per protein chart?