

How does data analysis with Progenesis QI work?
For efficient and objective analysis the process of importing files, selecting a reference run and aligning the runs can be performed automatically by our software. Then, the quality of your LC-MS runs can be assessed with objective alignment scores and visual displays for their potential to generate reliable measurements.
Here we’ll focus on the most fundamental steps within the Progenesis QI analysis workflow. Details of the automated data processing approach are covered separately here.
Importing your data
Progenesis QI supports data formats produced by all the LC-MS machines systems commonly used for untargeted compound analysis. As well analysing data from Waters high-definition mass-spectrometers you can also analyse data from, Thermo, Agilent, ABSciex and Bruker instruments. It also supports cross-vendor file formats including mzXML, mzML and NetCDF. Data can be in profile or centroid form, be high resolution or low resolution and have positive, negative or mixed ionization polarity.
We’re always looking to increase the number of file formats supported so if your instrument or file format isn't supported yet, contact us and we'll see what we can do to help.
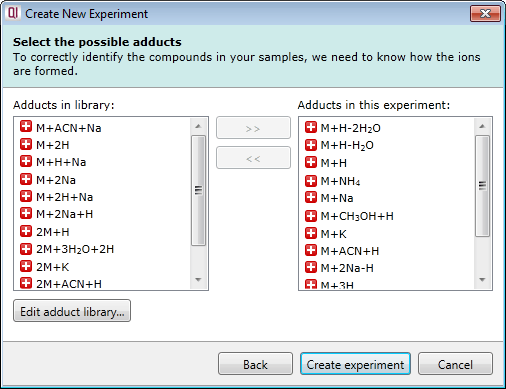
Select your possible adducts
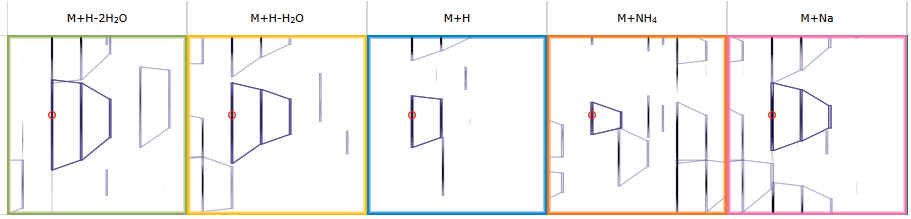
Prior to data import you are prompted to select from a list of possible adducts, including dimers and trimers, present in your samples. If a specific adduct is not listed it can easily be added to the list.
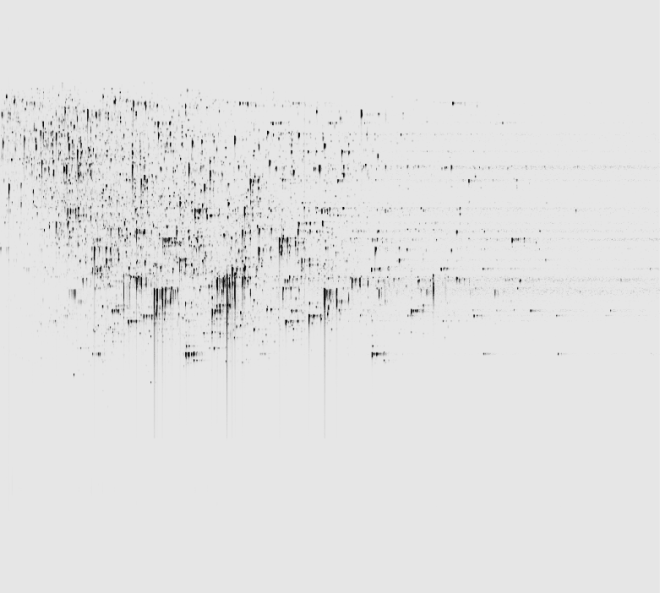
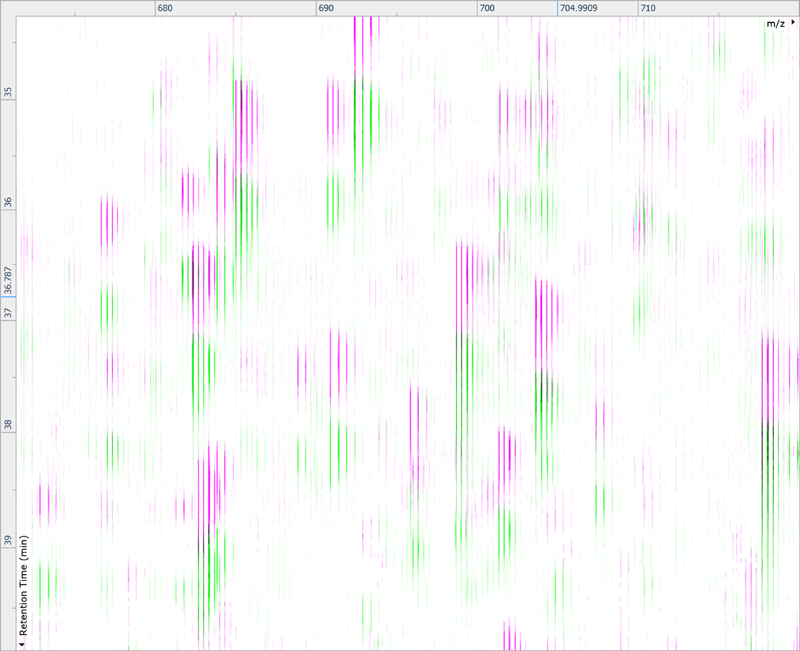
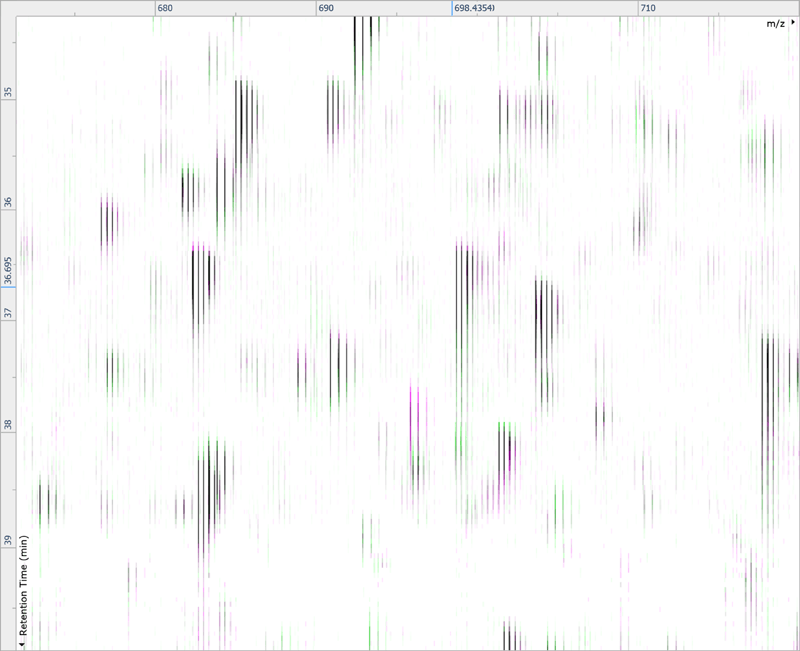
Ion intensity maps
After being imported, each run in your experiment is shown as an ion intensity map which is representative of the sample's MS signal by m/z and retention time. This gives an immediate visual quality check, highlighting any problems experienced in sample running.
Run alignment
The ability to combine data from multiple mass spec runs is required for comparative abundance profiling studies. This enables the comparison of different experimental conditions using a high number of replicates. To combine and compare results from different runs, Progenesis QI aligns them to compensate for between-run variation in the chromatography.
Peak picking
To ensure consistent peak picking and matching across all data files, an aggregate data set is created from the aligned runs. This contains all peak information from all sample files, allowing the detection of a single map of compound ions. This map is then applied to each sample, giving 100% matching of peaks with no missing values, so you can generate reliable results using valid multivariate statistical analysis.
The peak picking algorithm handles complex samples and can discern overlapping compound ions. The end result is highly accurate detection which saves time further down the workflow.
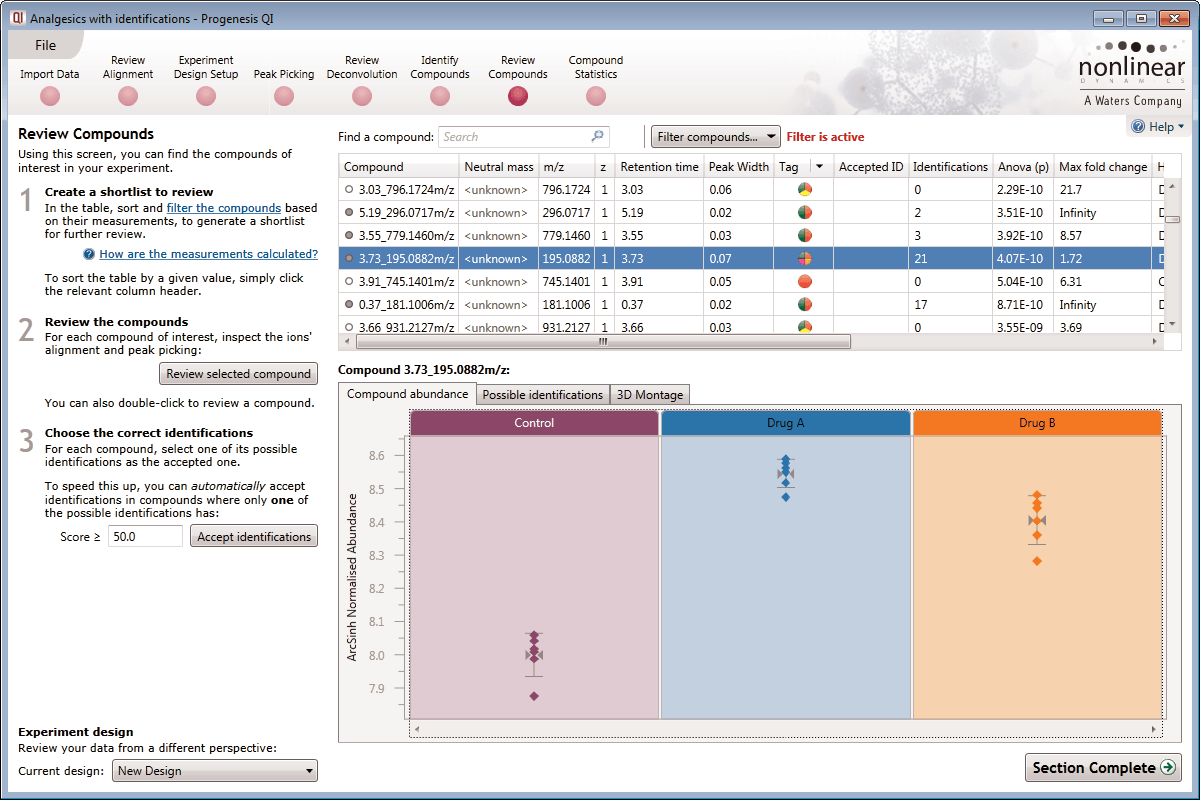
Compound results
This is where the results of quantification and identification (see below) are automatically brought together. All the compound ions are automatically deconvoluted to provide accurate quantitation of each compound.
After detection, the ion abundance measurements are normalised so we can make comparisons between the runs and find compounds of biological interest. You can choose the compound ions you want to identify based on the significance measures e.g. Anova p-value, fold change, power.
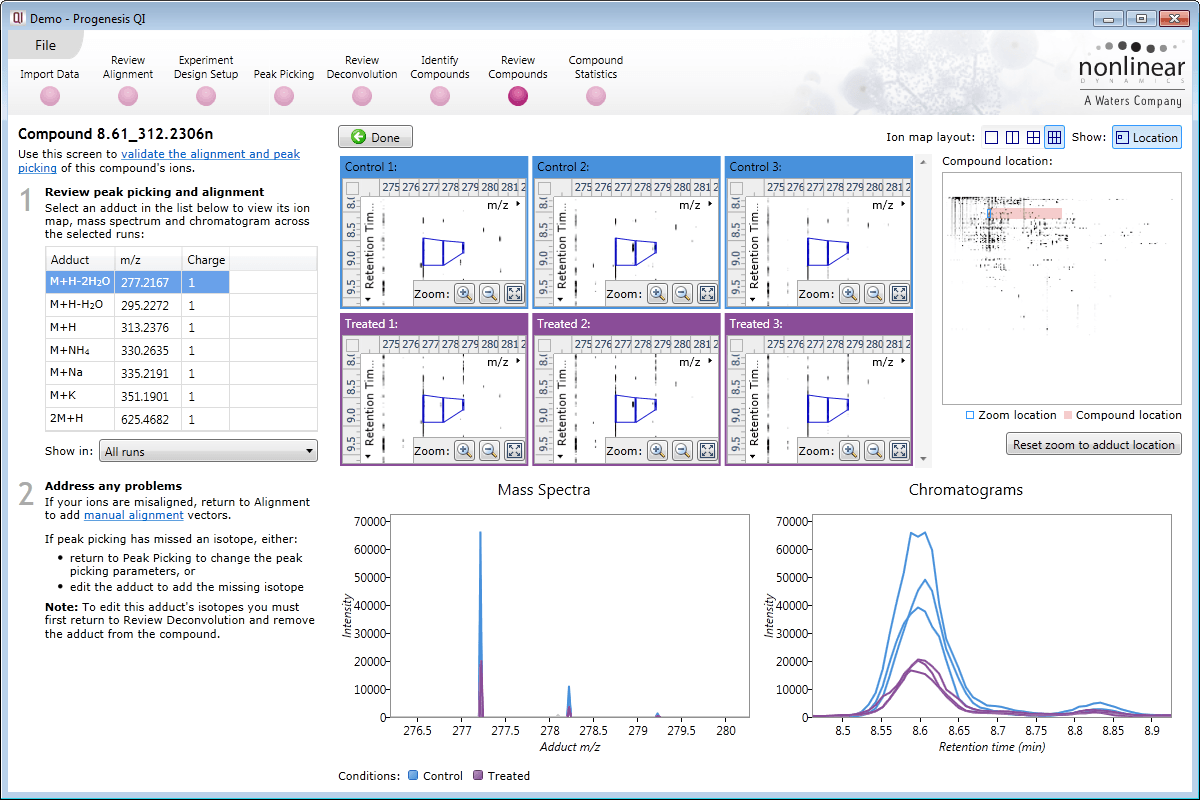
Ion intensity maps, 3D views, mass spectra and chromatograms are displayed for each compound ion on all runs to provide quality assurance of peak picking and alignment. You can edit peak picking on any run and make the same change to the same feature across all runs.
Compounds which have more than one possible identification can be reviewed so you can narrow down the results and select the correct identification. This review step also displays the measured isotope distribution compared to the theoretical. This isotope distribution match contributes to the overall compound identification score.
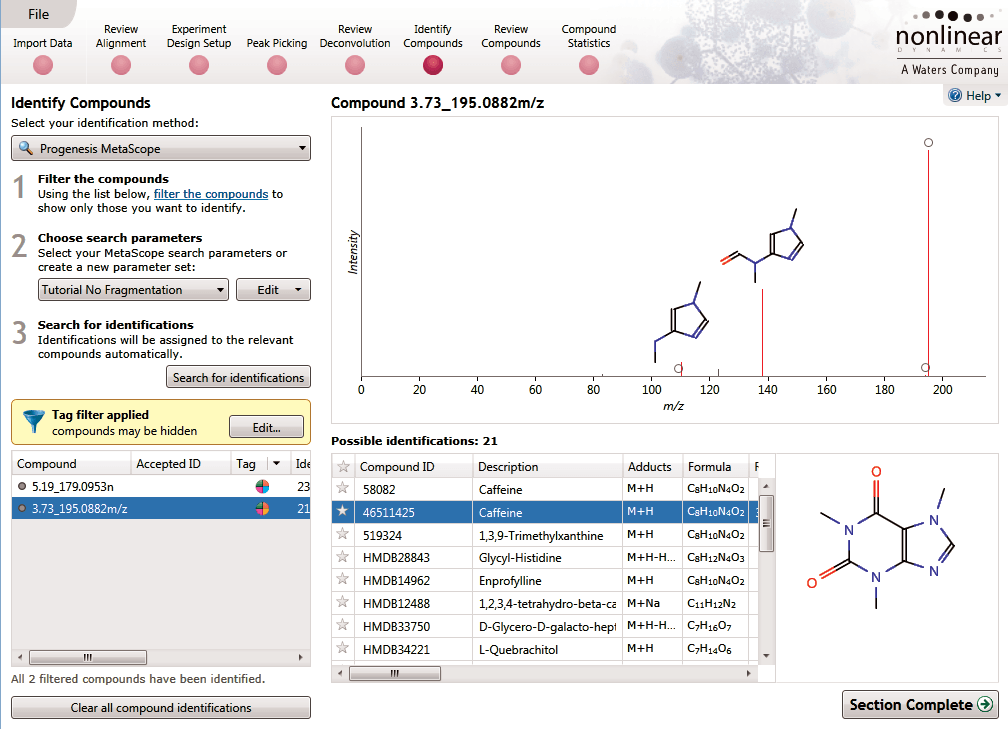
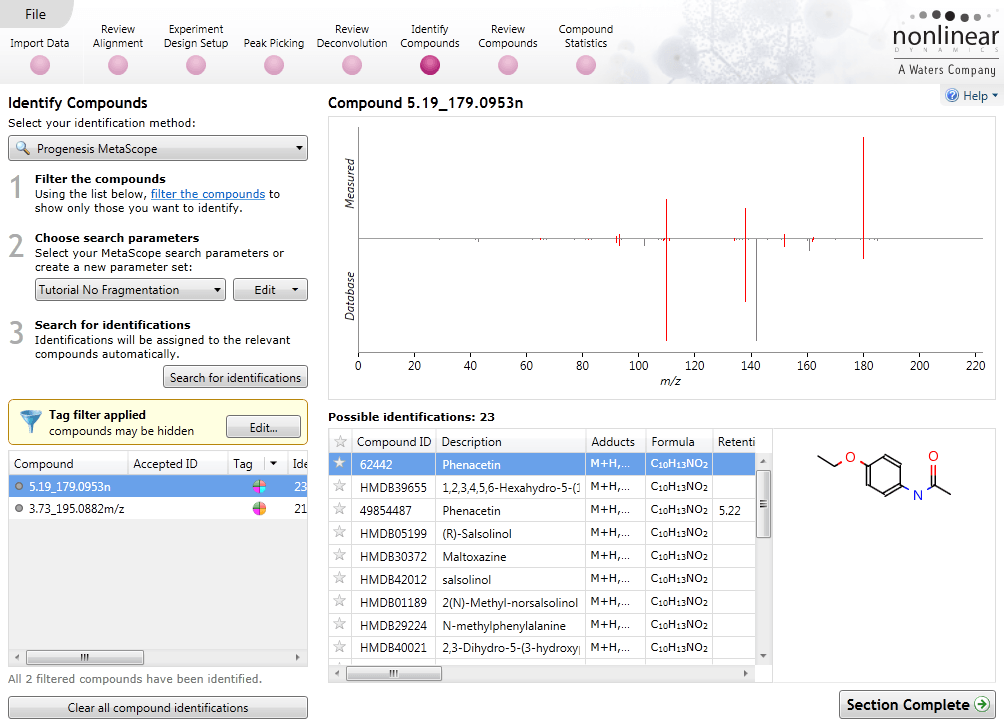
Identify Compounds
Once you have a list of detected compound ions that you want to identify, MetaScope allows you to search for compound identifications based not only on neutral mass and retention time (if data was available) but also collisional cross-sectional area (CCS) and MS/MS fragmentation data. Two different workflows are available to help you identify compounds using MS/MS fragmentation data:
- Theoretical fragmentation: Your experimental fragmentation data is compared to theoretical fragmentation patterns generated by the simulated breaking of bonds in the structures of possible identifications and scored.
- Fragment database search: Your experimental fragmentation data is compared to known fragmentation patterns of a library of compounds, which are stored in a fragment database you have created or accessed on-line, and scored. This feature allows you to export MS/MS spectra and create your own databases of accepted identifications for use in future ID searches.
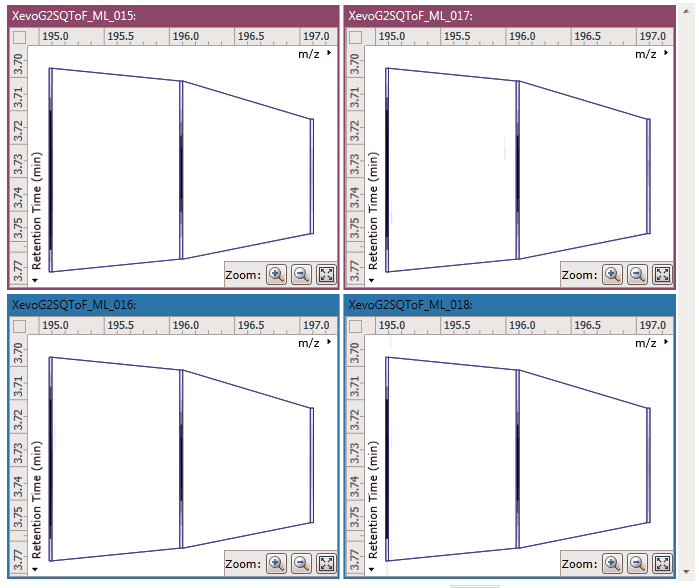
Review Deconvolution
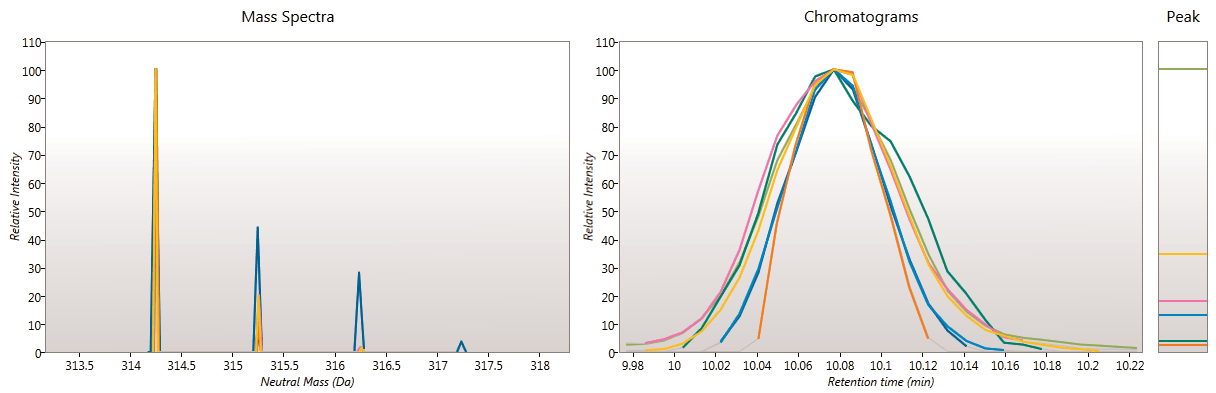
Here you can review all the compound ions, used to quantify and identify a compound, as a montage of detected features. Mass spectra and extracted ion chromatograms are also displayed for each compound ion, showing how similar they are. This is useful in visually checking the quality of data underlying each quantified compound.
If any compounds have an ion whose profile appears as an outlier in terms of its m/z and RT characteristics, within expected limits, it can be removed. Likewise, you have the opportunity to look if a compound ion appears at an expected position on the ion intensity map and, if it is present, add it to the compound quantification calculation.
Multivariate statistical analysis and integrate results with other bioinformatics
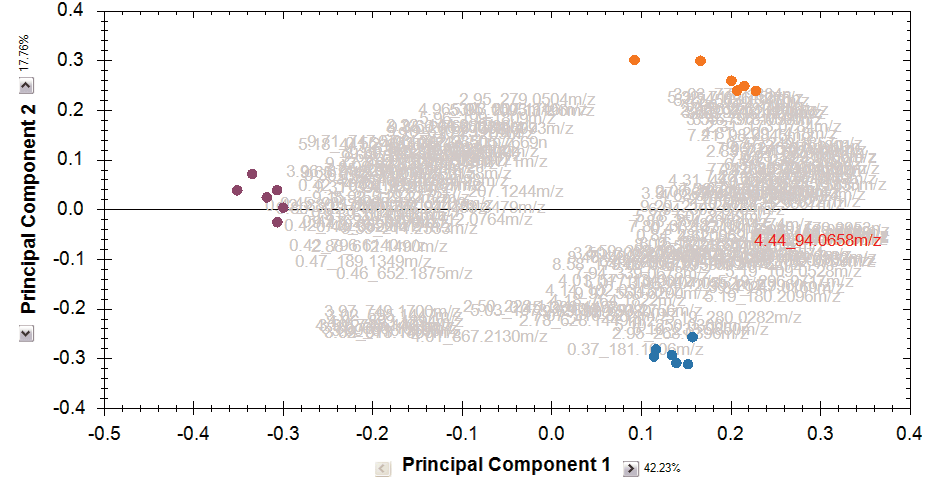
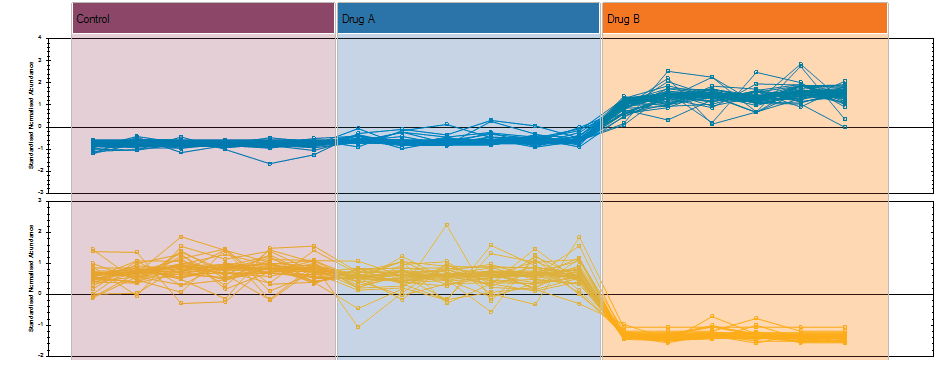
Finally, you can explore the list of quantified and identified compounds using an in-built set of easy-to-use multivariate statistical tools to generate results including: Principal Components Analysis, Correlation Analysis, False Discovery Rate q-values and a view of how adduct abundance varies between runs.
Progenesis QI also helps you to put your results into a wider biological context. Quantification data, including raw abundance of every isotope peak for every adduct, and identification results can be easily exported and linked with other ‘omics data or used as the basis for further bioinformatics. Results from any downstream bioinformatics can be imported back into your analysed experiment to combine all your compound data into one table to review or share.