


How can I export my compound measurements?
Upon selecting the File | Export compound measurements… option at the Identify Compounds or Review Compounds stages, you will be presented with a dialog box asking you to specify which compound properties you wish to export:
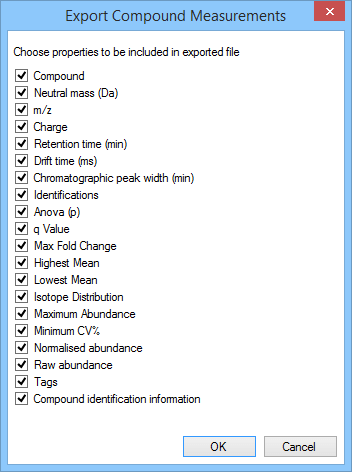
The selection dialog box for Export compound measurements, as it appears for the tutorial data set.
The selected data will be exported to a csv (comma-separated-values) file, which can be opened in Excel (among other programs). A pop-up dialog will ask you to name and save the file, and then on generation of the file you will be given the opportunity to open the file or its folder immediately.
In the csv file, the compounds are the rows, and the columns are the data you selected for export, as shown below (click to expand):
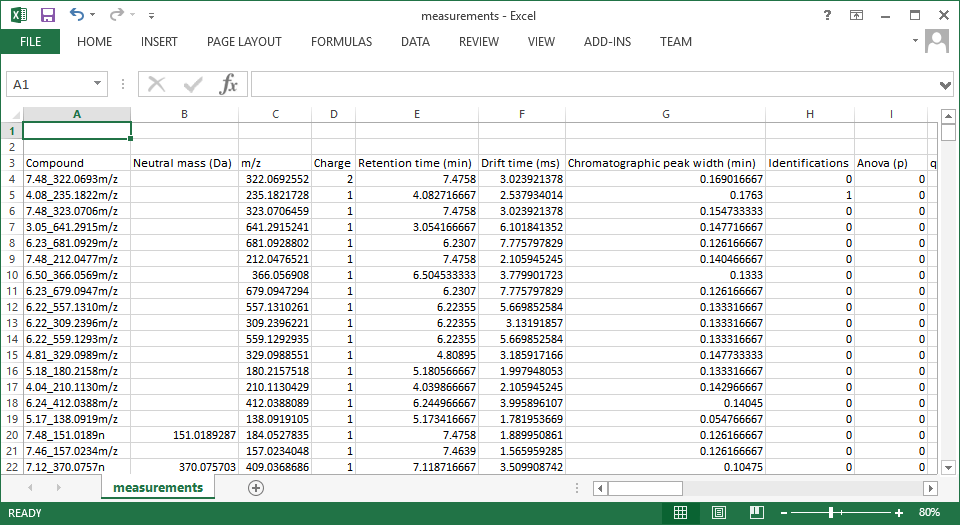
Screenshot of a csv export resulting from the Export compound measurements option.
Options
Details of the export options are tabulated below:
| Field | Details |
|---|---|
| Compound | Compound identifier as used by the software |
| Neutral mass (Da) | Neutral mass in Da, if established by deconvolution |
| m/z | m/z of the most abundant compound adduct |
| Charge | Charge of the most abundant compound adduct |
| Retention time (min) | Retention time of the compound on the aggregate profile |
| Drift time (ms) | Drift time in ion mobility, if applicable. Note: this appears only if you are using ion mobility data that is not calibrated. |
| CCS (angstrom^2) | Calibrated Collision Cross-Section (CCS) area in square angstroms Note: this appears only if you are using ion mobility data that is calibrated. |
| Chromatographic peak width (min) | Peak width of the compound in retention time on the aggregate profile |
| Identifications | The number of identifications currently associated with the compound |
| Anova (p) | ANOVA result for the current experiment design for the compound |
| q Value | q-value for the current experiment design for the compound |
| Max Fold Change | Largest fold change in normalised abundance for the compound between any two conditions in the current experiment design |
| Highest Mean | Condition in the current experiment design with the highest mean normalised abundance for the compound |
| Lowest Mean | Condition in the current experiment design with the lowest mean normalised abundance for the compound |
| Isotope Distribution | Relative intensity of each isotope present for the most abundant compound adduct |
| Maximum Abundance | Highest mean normalised abundance of the compound in any condition, in the current experiment design |
| Minimum CV% | Lowest intra-condition %CV for the compound normalised abundance, in the current experiment design |
| Normalised abundance | Normalised abundance for the compound in each run included in the current experiment design, listed run-by-run, and grouped by condition |
| Raw abundance | Raw abundance for the compound in each run included in the current experiment design, listed run-by-run, and grouped by condition |
| Tags | Any tags created in the experiment are listed as columns, with a cross in the cell if that compound bears that tag |
| Compound identification information | See below |
Selecting the "Compound identification information" option adds several further columns, as below. Note that these are mostly only populated for identifications that are accepted by the user.
| Field | Details |
|---|---|
| Accepted Compound ID | The ID accepted for this compound by the user, if any |
| Accepted Description | The description field for the ID accepted for this compound by the user, if any accepted |
| Adducts | The adducts present for the compound |
| Formula | The molecular formula of the accepted identification, if any accepted |
| Score | Identification score calculated by the software for the accepted identification, if any accepted |
| Fragmentation Score | Fragmentation sub-score calculated by the software for the accepted identification, if any accepted and if fragmentation used in identification |
| Mass Error (ppm) | Mass error for the compound, based on mean error of projected neutral mass from all adducts, as compared to the database ID neutral mass |
| Isotope Similarity | Isotope similarity sub-score calculated by the software for the accepted identification, if any accepted |
| Retention Time Error (mins) | Retention time error for the accepted identification (assuming database / additional properties search provides a comparator) |
| Compound Link | Link to the accepted compound information, if provided by the database search |