


How do I use the QC metrics missed cleavages chart?
This chart shows the proportional distribution of missed cleavages per identified peptide ion, across the whole experiment.
This chart is plotted assuming that proteins were treated with trypsin, and using each peptide ion’s highest scoring identification. An alternative visualisation showing the data subdivided by experimental condition is available in the Sample preparation metrics section.
In this case, the interpretation is relatively straightforward – an unusually high proportion of missed cleavages may indicate problems with trypsinisation. It should also be noted that identification parameters (for example, missed cleavages allowed) will naturally affect this chart, limiting the potential values taken.
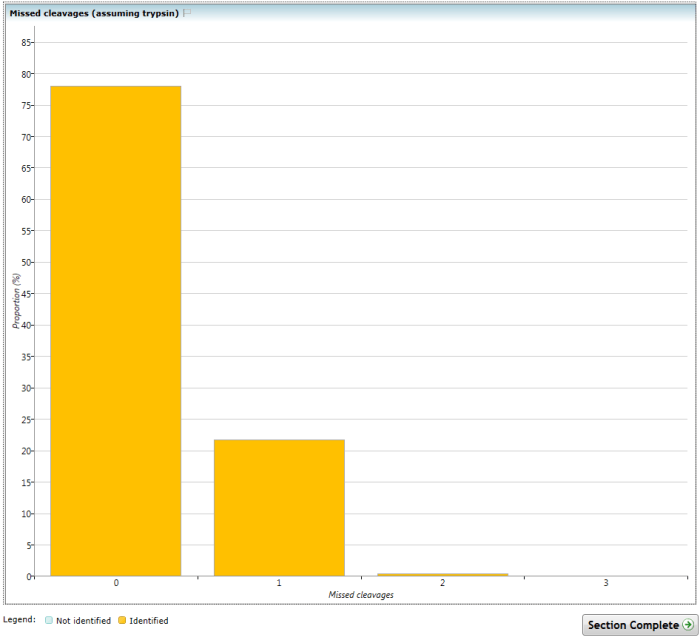
The (Overview) Missed cleavages chart.
See also
- How do I use the QC metrics screen?
- How do I use the QC metrics overview screen?
- How do I use the QC metrics identifications overview chart?
- How do I use the QC metrics LC peak width chart?
- How do I use the QC metrics peptide ion dynamic range chart?
- How do I use the QC metrics precursor m/z chart?
- How do I use the QC metrics precursor retention time chart?
- How do I use the QC metrics mass errors chart?
- How do I use the QC metrics precursor charges chart?
- How do I use the QC metrics peptides per protein chart?