


How do I use the QC metrics precursor retention time chart?
This chart complements the Precursor m/z chart, by plotting the proportional distribution of your MS1 precursor retention times, both identified and unidentified. Given the single aggregate codetection, this metric does not alter with experiment design – the value is based on the aggregate of runs.
Each bar represents the proportion of all peptide ions present that are within the binned retention time (RT) range. Identified peptide ions are also marked in yellow, to allow examination of the proportion of peptide ions identified throughout the run and any correlation with RT.
The expected distribution of this chart will depend on your chromatography conditions and sample. However, a highly uneven, skewed, distribution may indicate a problem and a lack of effective separation. A relative skew in the identified proportion may indicate variation in MS2/MSE performance, especially if using DDA with a relatively poorly separated sample. The MS1 scan rates chart in the Instrument metrics section may assist with the investigation of such problems.
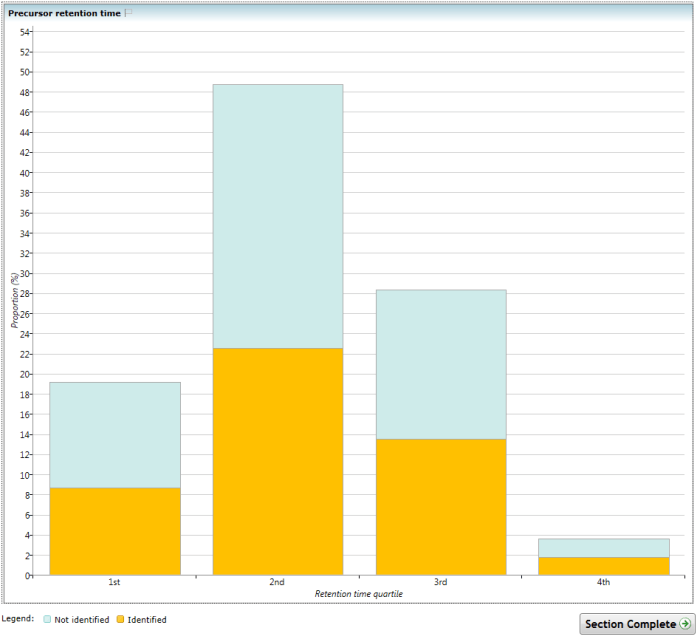
The Precursor retention time chart.
See also
- How do I use the QC metrics screen?
- How do I use the QC metrics overview screen?
- How do I use the QC metrics identifications overview chart?
- How do I use the QC metrics LC peak width chart?
- How do I use the QC metrics peptide ion dynamic range chart?
- How do I use the QC metrics precursor m/z chart?
- How do I use the QC metrics mass errors chart?
- How do I use the QC metrics precursor charges chart?
- How do I use the QC metrics missed cleavages chart?
- How do I use the QC metrics peptides per protein chart?